Top 14 Charts About the Budget in 2014
This year was an eventful one for the federal budget. To explain the year's events, CRFB wrote 427 blogs, 17 papers, and created more than a hundred charts. Below are some of our favorite charts that represent the budget events of 2014.
1. Debt scheduled to reach record levels only seen around WWII within 25 years
Our long-term debt problem remains unsolved, despite some commentators' claims that the debt is not worth worrying about. For instance, economist Paul Krugman said not to worry because the debt in 25 years will only reach the levels we had in World War II. In Actually, Paul, the Debt is Still a Problem, we showed how returning to World War II levels of debt is actually quite alarming. Not only will debt levels be too high, but they are projected to keep rising upwards, without a sharp decline like the 1950s.

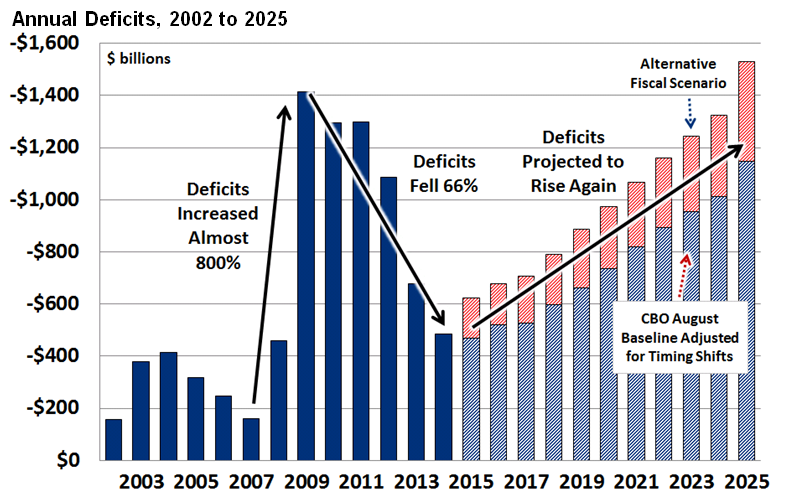
2. 2014 deficit decreased by 66%, but only after an 800% rise
September marked the end of the 2014 fiscal year, and saw year-end deficits fall to their lowest level since the Great Recession. Some claimed victory over the debt and urged moving onto other issues. In our report, Deficit Falls to $483 Billion, but Debt Continues to Rise, we showed that these low deficits are nothing to celebrate. In dollar terms, the deficit may have decreased by 66 percent, but that was after it had risen by almost 800 percent during the Great Recession. Moreover, debt remains at a post-WWII record high, and trillion-dollar deficits are likely to return within a decade.
 Tweet This Chart
3. Debt is worse if Congress does not pay for changes
These debt projections assume that Congress will be fiscally responsible and pay for all new legislation. However, if they stick to the all-too-common practice of continuing various policies or enacting new ones without offsetting the cost, the debt situation could be almost 10 percent of GDP worse, as this animated chart from Everything You Need to Know About Budget Gimmicks shows.
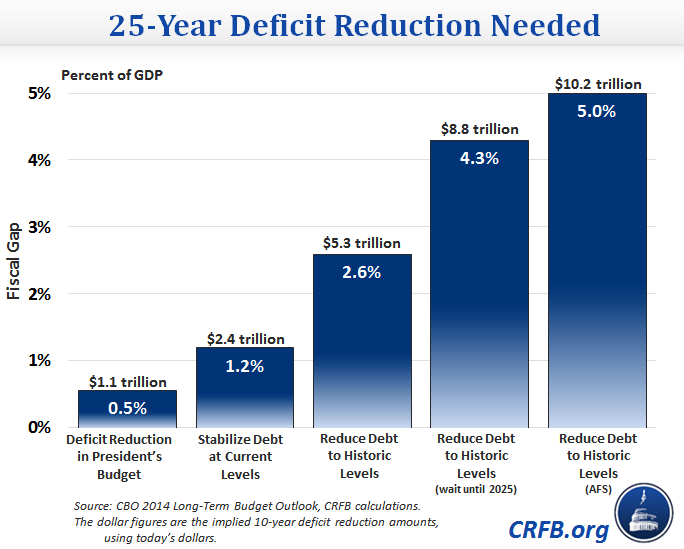
4. How much more deficit reduction is needed?
Although some progress has been made, a lot more deficit reduction will need to be done in order to bring our debt down to sustainable levels. In order to stabilize the debt as a share of GDP, policymakers would need to enact deficit reduction equal to 1.2 percent of GDP over 25 years (or about $2.4 trillion in 10-year deficit reduction). As this graph from Actually, Paul, the Debt is Still a Problem shows, we need changes equal to 2.6 percent of GDP to bring debt back to its historic levels in 25 years (or about $5.3 trillion in 10-year savings). It will take even more if we wait to act.
5. The highway shortfall remains unaddressed
At the end of July, Congress passed a short-term fix to the Highway Trust Fund, transferring $11 billion to continue highway spending at current levels (the gas tax hasn't consistently provided enough revenue for highways since 2000). In advance of that discussion, we published a report Trust or Bust: Fixing the Highway Trust Fund that lays out the problem of the unaddressed shortfall and potential solutions including cutting spending, raising more from current highway taxes, or raising new taxes. The one-time transfer of funds did little to address the transportation shortfall of more than $170 billion over the next ten years, requiring highway spending to be reduced by about one third, the gas tax to be increased by 15 cents, or some combination of options.
![]()
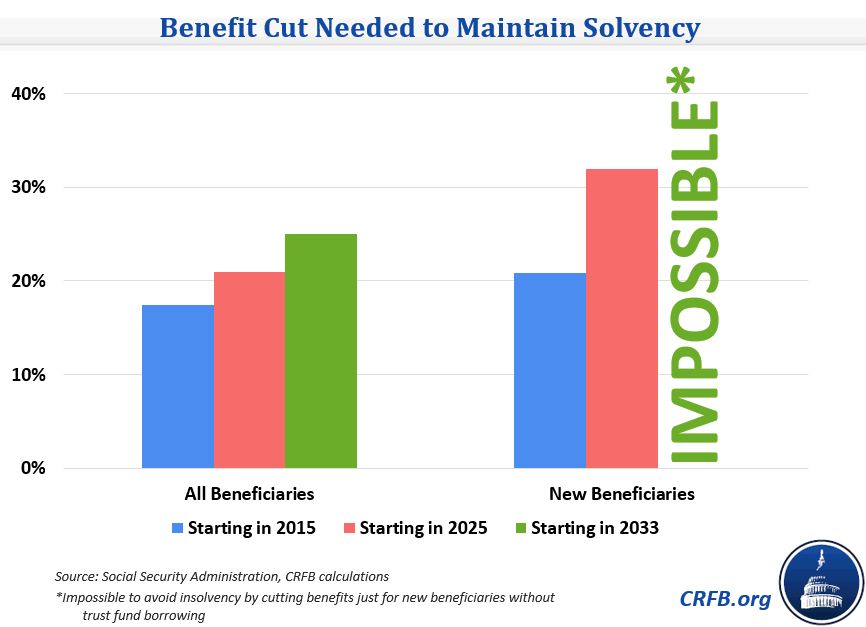
6. Waiting to restore Social Security makes it more difficult
In their annual report, the Social Security Trustees highlighted the program's financial challenges. Driven by the mass retirement of the baby boomers, the program is expected to become insolvent by 2033, at which point benefits would be automatically cut by almost 25 percent across-the-board. As we explained in our post Updating the Cost of Delay for Social Security, it is better to address the funding gap sooner rather than later. The longer we wait, the larger the benefit cuts or tax increases will need to be. Indeed, the system could be made solvent today by a 2.8 percentage point tax increase or a 17 percent cut in benefits. If lawmakers wait until 2033, restoring solvency would require a 4.3 percentage point tax increase or a 25 percent cut in benefits.
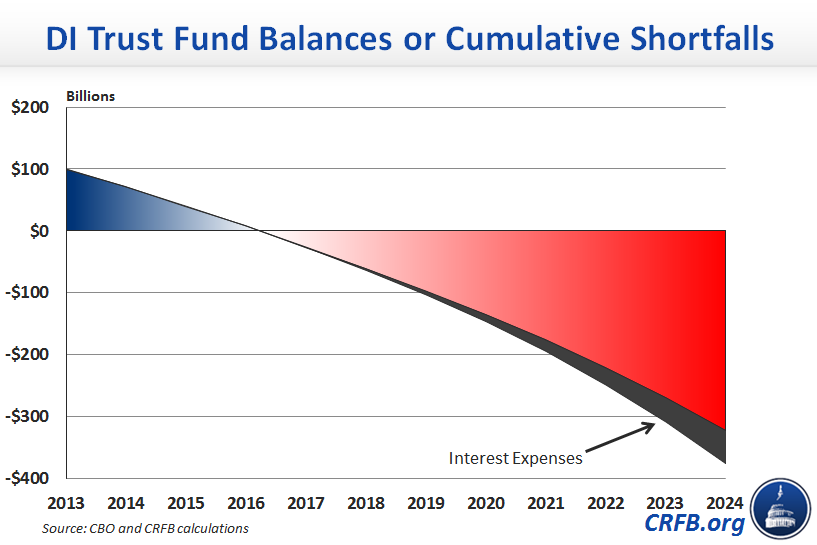
7. Social Security Disability Insurance will be insolvent within two years
Another part of the Social Security program that provides Disability Insurance (DI) to most workers is in even more serious trouble, set to become insolvent in late 2016. In Good News and Bad News for Federal Trust Funds, we showed CBO's projection for the SSDI trust fund. The looming insolvency is one reason the SSDI Solutions Initiative is exploring ways to improve the program.
8. Medicare's cost slowdown has been most pronounced in the prescription drug program
Over the course of 2014, many health policy experts talked about the dramatic slowdown in health spending in recent years, and whether it is because of the slow economy or a portent of more lasting changes in health care. Original research by our staff demonstrated that Medicare Part D is responsible for between one-half and two-thirds of the slowdown, despite being only one-tenth of the Medicare program in Medicare's Slowdown: A Story About Part D.
9. Annual "doc fixes" have led to substantial real health savingsDespite the health slowdown, health cost growth is still one of the main drivers of the debt and one that Congress touches on each year when they pass an annual "doc fix," preventing prescribed cuts to Medicare physician payments under the Sustainable Growth Rate (SGR) formula. Since the SGR has been an issue every year since 2003, some lawmakers want to stop paying for the annual fix. In SGR Continues to Slow Health Care Cost Growth, we show that lawmakers have almost always paid for the fixes with savings predominantly from health care through the need to offset the cost of the patch. In fact, while patching the SGR has cost $175 billion since 2003, it has led to almost as much, $165 billion, in deficit reduction. Those who argue we should repeal the SGR without offsets often ignore the good it has done in reducing health spending.

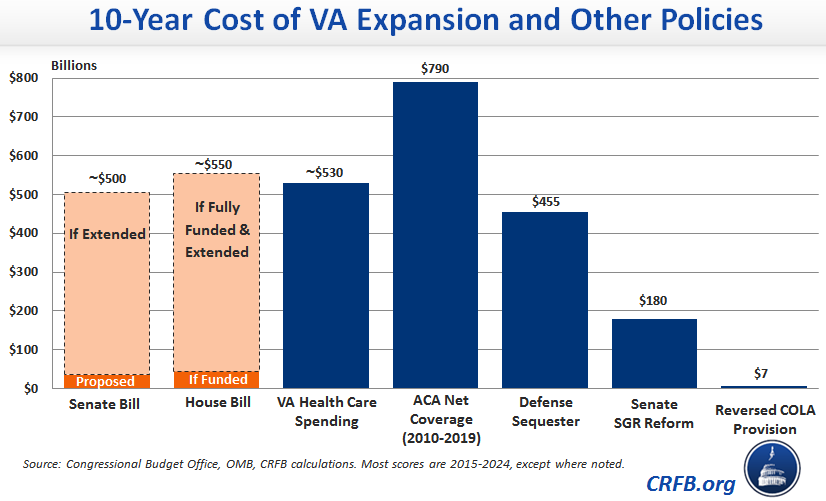
10. Congress considered an increase in veterans spending that would have cost $500 billion
This summer, reports of substandard care in the veterans’ health care system prompted Congress to discuss improvements to the VA system. The first proposals by Congress to solve the problem would have started temporary programs that, if extended, could have eventually cost $500 and $550 billion, respectively, approximately double the VA's current health budget. Citing cost concerns, the bill's final version was much smaller, partially offset, and added $10 billion to the debt.
11. Using phony war savings would open up a huge slush fund
One potential gimmick that lawmakers discussed to pay for the SGR or VA health bills was to limit war spending. But this offset is fake since war spending is already scheduled to decline as the troops withdraw from Afghanistan and Iraq. Claiming those savings to pay for any other policies could open up a $600 billion slush fund of phony savings, as we showed in Everything You Need to Know About Budget Gimmicks.

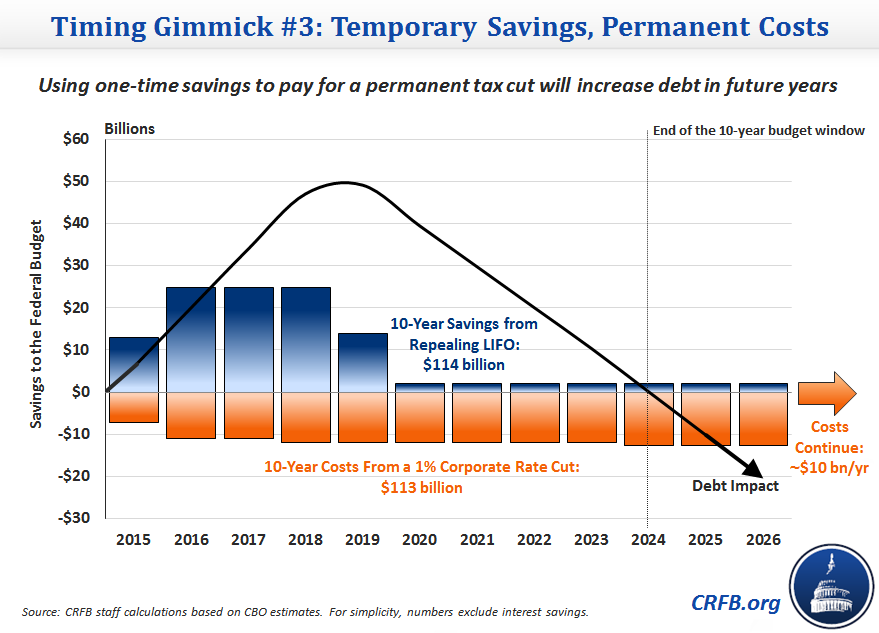
12. Paying for long-term costs with temporary savings increases the debt
One way to cheat current budget rules is to take advantage of the fact that costs are measured over a ten-year window. Changes which increase the deficit beyond that window do not appear in official budget scores. In Everything You Need to Know About Budget Gimmicks, we showed an example how this gimmick might work in tax reform. Because it raises a substantial amount of temporary revenue, repealing a preferential inventory rule known as “Last In First Out” (LIFO) would raise enough money over ten years to pay for a 1 percent corporate rate cut – but that money wouldn’t last. If LIFO repeal was enacted together with a 1 percent rate cut, deficits would grow by about $10 billion per year after the transition. Policymakers must be mindful of the long-term to avoid these types of gimmicks.
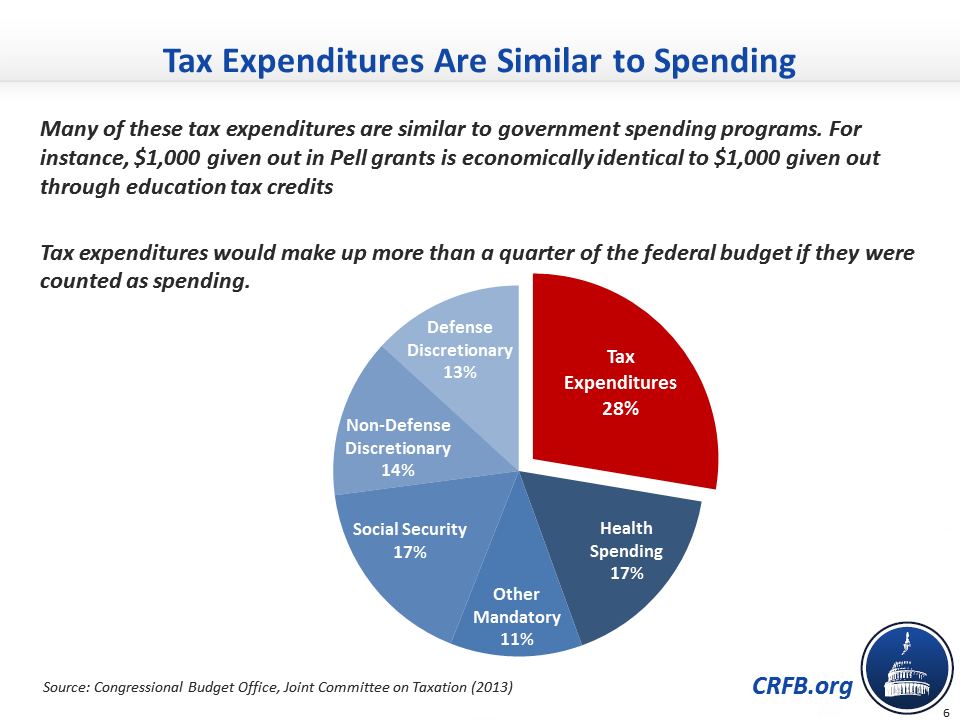
13. Over a trillion dollars of tax expenditures are like spending, but not closely scrutinized
Discussions about tax reform continued this year, with a tax reform bill introduced by outgoing Ways & Means Chairman Dave Camp (R-MI), a final discussion draft released by former Finance Committee Chairman Max Baucus (D-MT), and ongoing Finance Committee hearings. Tax reform would be a chance to evaluate the tax code's $1.2 trillion of tax expenditures, which are often structured just like spending programs but subject to far less scrutiny. Indeed, they would be more than a quarter of the budget if they were counted as spending, as we showed in Tax Day 2014: Ten Charts to Explain our Federal Tax System.
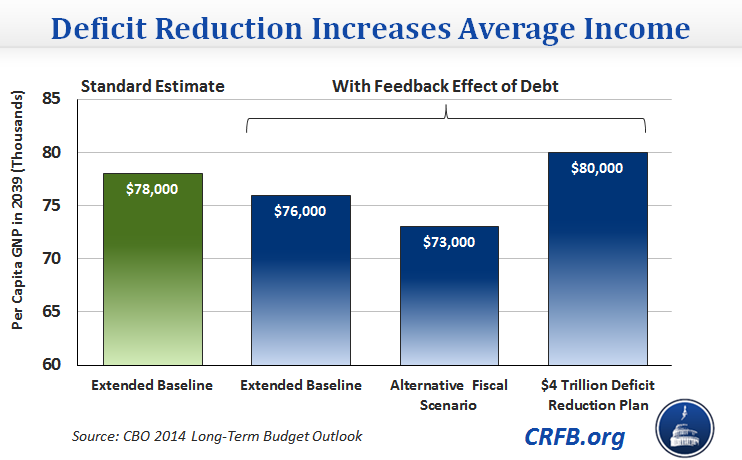
14. Deficit reduction increases average income
A smart, credible plan to reduce long-term deficits can boost the economy by keeping down interest rates and reducing the amount that government debt crowds out private investment. In High Debt Drags Down The Economy, we highlight CBO estimates about the amount of economic harm caused by high debt and the economic bonus of deficit reduction. The average person's income could be $7,000 higher under a debt-reducing plan relative to one that increases the debt.