Long-Term Budget Outlook Underlines Trouble Ahead for Social Security
The Congressional Budget Office's (CBO) 2016 Long-Term Budget Outlook release came with updated projections of the 75-year solvency of Social Security. CBO now projects that Social Security faces a 75-year shortfall of 4.7 percent of taxable payroll – 0.3 percentage points worse than its projections from December – but maintains an exhaustion date of 2029.
Previously, we posted a blog discussing the differences between this year's Social Security Trustees Report's estimates of the program's financial shortfall, CBO's 2015 estimates, and the 2015 Technical Panel to the Social Security Advisory Board's estimates. With its new outlook, CBO continues to project a much worse shortfall than the Trustees, even when adopting the more optimistic mortality and disability incidence assumptions recommended by the Technical Panel. The 2016 differences are mostly due to a worse economic picture over the next 75 years – partially a result of CBO incorporating economic feedback effects of higher debt in their numbers. CBO also projects persistently low interest rates – a net positive in terms of growing debt but troublesome in terms of economic growth prospects and problematic for Social Security, whose trust fund benefits from higher interest rates.
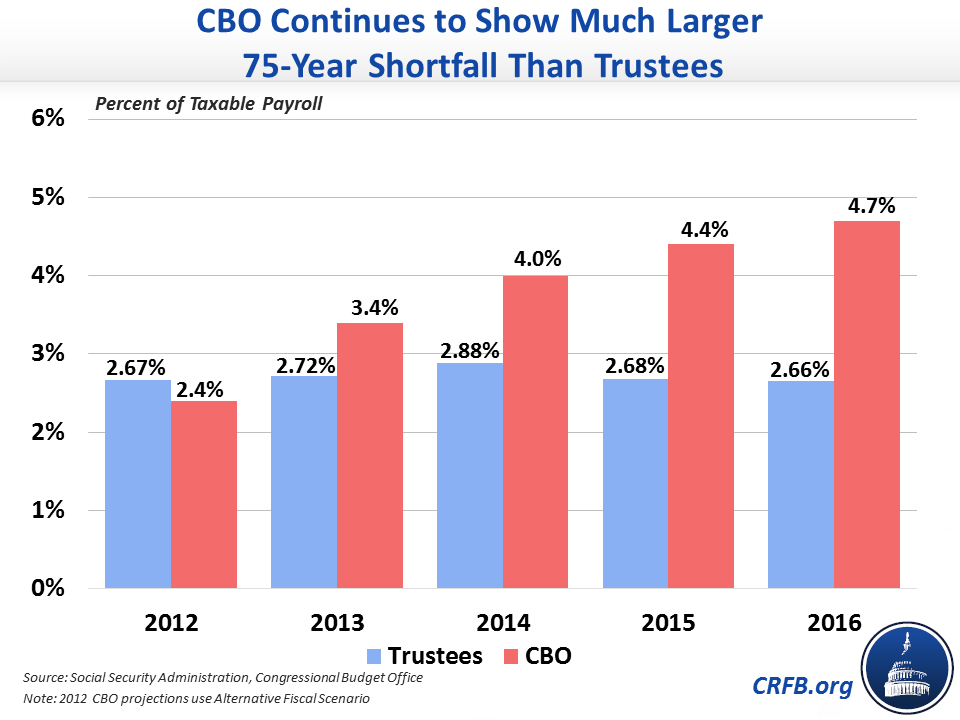
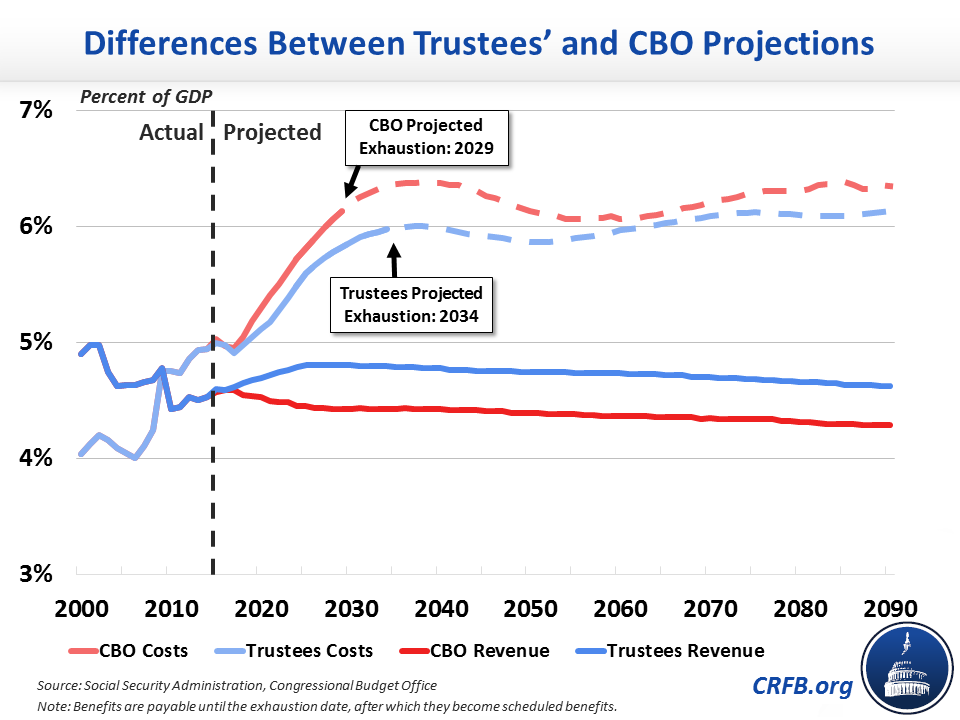
As we've noted before, CBO and the Trustees continue to move farther and farther apart on their projections of Social Security's fiscal health. As recently as 2012, CBO projected a smaller shortfall than the Trustees, but since 2013, the two scoring agencies have continued to diverge based on differing assumptions. They also project different dates for exhaustion – CBO says 2029 while the Trustees say 2034 – which remain unchanged from last year despite the long-term fiscal health deteriorating according to CBO and slightly improving according to the Trustees.
Explaining the Divergence
CBO offers an explanation for their differences with the Social Security Trustees:
The Social Security trustees have estimated that the program’s 75-year actuarial shortfall would be 2.7 percent of taxable payroll, 2.0 percentage points smaller than CBO’s projection. The larger shortfall projected by CBO primarily stems from differences in the projections of interest rates and taxable payroll. Differences in projections involving life expectancy, fertility, and growth in the consumer price index also contribute.
CBO makes clearly different assumptions on interest rates and taxable payroll than the Trustees (as will be explained further below). For other differences in assumptions, CBO explains that it has mostly adopted the recommendations of the Technical Panel on fertility and disability incidence while using a slightly higher immigration rate than both the Trustees and the Technical Panel. On life expectancy, CBO uses assumptions that it states are slightly higher than the Trustees and slightly lower than the Technical Panel recommends. Specifically, CBO projects life expectancy for those born in 2090 to be 87.3 years at birth and 24.6 years for those turning 65 in that year; this compares to the Trustees' projections of 85.9 and 23.6 years, respectively – but both are lower than the Technical Panel's projections of 88.3 and 25.3 years, respectively. Life expectancy is especially important in projecting program costs later in the 75-year window as life expectancy gets longer and beneficiaries receive larger benefits for a longer amount of time. However, CBO states that ultimately all these demographic differences tend to cancel each other out.
On interest rates, CBO generally assumes that the current lower-than-historical real interest rates will persist over the next 75 years, leading them to assume that the average rate for Treasury bonds purchased by the Social Security Trust Funds (which have slightly higher interest rates than other Treasury bonds) will only average about 1.9 percent – compared to 2.7 percent projected by the Trustees and 2.5 percent by the Technical Panel. Last year, CBO estimated that real interest rates would average 2.3 percent.
On taxable payroll, as we noted last year, the difference is explained by CBO taking into account growing inequality (as well as some very slightly less optimistic economic growth assumptions midway through the window). CBO projects that 78 percent of earnings will be subject to the payroll tax over the next 30 years, down from about 83 percent currently, while the Trustees maintain their projection of 82.5 percent.
These differences translate to a fairly large divergence over 75 years. CBO estimates a 75-year actuarial shortfall of 4.7 percent of payroll, about 75 percent higher than the Trustees' estimate of 2.66 percent of payroll.
As a share of the economy, there are also significant differences. Over 75 years, CBO estimates a shortfall of 1.6 percent of GDP, compared to 0.95 percent for the Trustees. By 2090, CBO estimates an annual shortfall of 2.1 percent of GDP, compared to 1.5 percent for the Trustees.
***
Regardless of which agency's projections are right, their projections underline the problems facing Social Security in the next few decades. Using reasonable assumptions, both agencies came to the conclusion that the trust funds will face insolvency within the next 20 years – and possibly in just 13 years. Now is the time to start making reasonable changes to Social Security rather than waiting until the last minute when the necessary changes become much more drastic. Instead of discussing ways to expand a program whose funds are already strained, policymakers should be taking an approach like Representative Reid Ribble (R-WI) or the Bipartisan Policy Center by considering both spending and revenue changes to ensure the long-term health of this important program for millions of beneficiaries across the country.
What's Next
-

-
Image

-