Report: The 2016 CBO Long-Term Budget Outlook
The Congressional Budget Office (CBO) released its 2016 Long-Term Budget Outlook today, outlining the projected budget picture for the next three decades. The report projects debt will rise continuously as a share of the economy, leading to significant negative consequences.
The report shows:
- Debt is Growing Unsustainably Over the Long Run. CBO’s Extended Baseline Scenario, which assumes lawmakers abide by current law, shows debt held by the public rising from 75 percent of GDP in 2016 to 141 percent by 2046. This is significantly worse than last year’s projections.
- Spending Growth Will Outpace Revenue. CBO projects that total spending will grow from 21.1 percent of GDP in 2016 to 28.2 percent in 2046 while revenue will grow much more slowly from 18.2 percent of GDP in 2016 to 19.4 percent by 2046. Both will be well above their historical averages of 20.2 and 17.4 percent, respectively, over the past half century.
- Rising Debt Will Hurt Economic Growth. CBO estimates the accumulation of debt projected under the Extended Baseline would reduce the size of the economy by nearly 5 percent by 2046 as compared to putting debt on a gradual downward path relative to the economy. As a result, per-capita Gross National Product (GNP) will be about $4,000 smaller in 2046 under current law than with sustainable debt.
- Rising Debt Has Other Important Costs. In addition to slowing economic growth, CBO warns that the growing national debt may squeeze out other important priorities, leave lawmakers less able to respond to unforeseen events, and increase the risk of an eventual fiscal crisis.
- The Cost of Waiting to Fix the Debt is High. Delaying the start of deficit reduction makes the needed adjustments larger. Policymakers could stabilize the debt-to-GDP ratio over the next three decades by reducing non-interest spending and/or increasing revenues by 1.7 percent of GDP starting today, an adjustment that would grow to 2.7 percent of GDP if they wait just ten years. Similarly, restoring the debt to its historical averages would require a 2.9 percent of GDP adjustment starting today, but a 4.3 percent of GDP adjustment after ten years.
- Major Trust Funds are Heading Toward Insolvency. A number of major federal trust funds face exhaustion in the coming years, including the Highway Trust Fund in 2021, the Social Security Disability Insurance trust fund in 2022, the Medicare Part A (Hospital Insurance) trust fund in 2026, and the Social Security Old Age and Survivors Insurance trust fund in 2030.
Debt is Growing Unsustainably Over the Long Run
CBO expects a significant surge in the national debt as the baby boom population continues to retire, interest rates rise, and health care costs grow. Under CBO’s Extended Baseline Scenario, debt is projected to grow from 75 percent of GDP today to 86 percent of GDP by 2026 and 141 percent by 2046.
Under these projections, debt will exceed the size of the economy by 2033, exceed all-time record highs set after World War II by 2035, and likely double as a share of the economy before 2050. This is particularly troubling since debt levels are already nearly twice their historical averages and higher than any time in history other than around World War II.
Fig. 1: Debt as a Percentage of GDP, 1980-2046

A number of technical, economic, and legislative factors are responsible for this deteriorating fiscal outcome. Chief among them is last year’s end-of-year tax and budget deal, which we estimated at the time would cost over $800 billion over ten years and $2 trillion over two decades.
Rising debt is the byproduct of growing annual budget deficits. CBO projects that deficits will double from 2.9 percent of GDP in 2016 to 5.8 percent by 2030 and triple to 8.8 percent of GDP by 2046.
Unfortunately, CBO’s Extended Baseline Scenario represents a fairly optimistic view of lawmakers’ decisions over the long term. It assumes that Congress maintains the sequester without resorting to gimmicks, allows a variety of previously-extended tax breaks to expire or remain expired, allows revenue to rise continuously as a share of GDP, allows discretionary spending to continue falling below its historical low as a share of GDP, and does not pursue any new spending programs or tax reductions – such as those being discussed in the presidential campaign – without full and gimmick-free offsets.
Were policymakers to continue to enact irresponsible fiscal policy, the debt situation would be far worse. As an example, CBO estimates that adding $2 trillion of non-interest spending and/or tax breaks over a decade would drive debt levels from 75 percent of GDP today to nearly 193 percent of GDP by 2046.
Spending Growth Will Outpace Revenue
Growing long-term deficits and debt result from spending growing faster than revenue.
CBO projects that total spending will grow from 21.1 percent of GDP in 2016 to 23.1 percent in 2026 and 28.2 percent in 2046. By comparison, the 50-year historical average for spending is 20.2 percent of GDP.
CBO projects revenues to grow as well, but much more slowly and from a lower starting point. Revenues will hover just above 18 percent of GDP for the next ten years before slowly growing to 19.4 percent of GDP in 2046. This compares to a historical average of 17.4 percent of GDP.
Fig. 2:Projections under CBO's Extended Baseline (Percent of GDP)
| 2000 | 2016 | 2026 | 2036 | 2046 | |
|---|---|---|---|---|---|
| Spending | 17.6% | 21.1% | 23.1% | 25.9% | 28.2% |
| Revenue | 20.0% | 18.2% | 18.2% | 18.8% | 19.4% |
| Deficit | -2.3% | 2.9% | 4.9% | 7.1% | 8.8% |
| Debt | 34% | 75% | 86% | 110% | 141% |
Note: Projections include macroeconomic feedback.
Driving spending growth is the rising cost of health care, Social Security, and interest on the debt. These three areas of the budget are responsible for 154 percent of the growth in the deficit (changes in revenue and other spending will partially offset this), and by 2038 these three categories will consume every dollar of revenue raised by the federal government.
Despite the recent slowdown in health care spending growth, federal health costs are projected to rise from 5.5 percent of GDP in 2016 to 6.5 percent in 2026, and 8.8 percent in 2046. About three-quarters of this growth over the next few decades is projected to come from Medicare, which provides health insurance to seniors and certain disabled workers. This is true both because Medicare represents the majority of federal health spending and its costs are being driven up by the retirement of the baby boomers and aging of the population.
The same demographic trends are also driving up Social Security spending, which has already grown from 4.0 percent of GDP in 2000 to 4.9 percent today, and is projected to further grow to 5.9 percent by 2026 and 6.3 percent by 2046.
Fig. 3: Composition of Spending and Revenue (Percent of GDP)
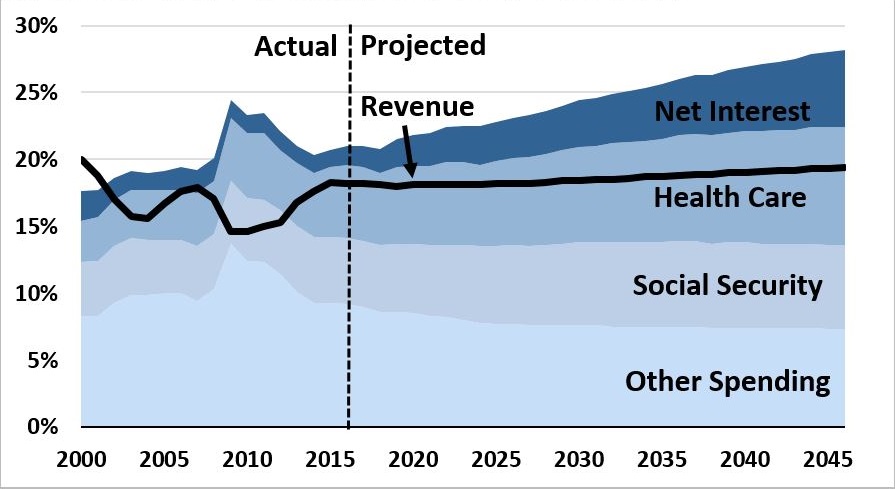
The largest spending growth, however, will come from interest. Rising interest rates, combined with growing debt levels, will also cause interest on the debt to balloon. Under CBO’s baseline, interest spending as a share of GDP will double within eight years, and double again by 2045. In total, interest costs will grow from 1.4 percent today to 3.0 percent of GDP in 2026 to 5.8 percent by 2046.
Rising Debt Will Hurt Economic Growth
As CBO explains, rising debt will slow economic growth over the long run. By diverting private savings from productive investment in favor of Treasury bonds, higher debt will reduce the overall investment in the economy and in turn slow the growth of worker productivity, wages, and overall GDP growth.
CBO’s baseline projections incorporate these negative effects. Compared to a situation in which debt will be on a downward path relative to the economy (as represented by $4 trillion of non-interest deficit reduction over a decade), economic output will be nearly 5 percent smaller under CBO’s baseline in 2046. In today’s dollars, that means per-capita Gross National Product (GNP) – a rough measure of per-person income – will be about $4,000 lower. CBO also estimates interest rates will be about three quarters of a percentage point higher than under a sustainable debt scenario.
Fig. 4: Effect of Different Fiscal Paths on Per-Capita GNP in 2046 (in 2016 dollars)1
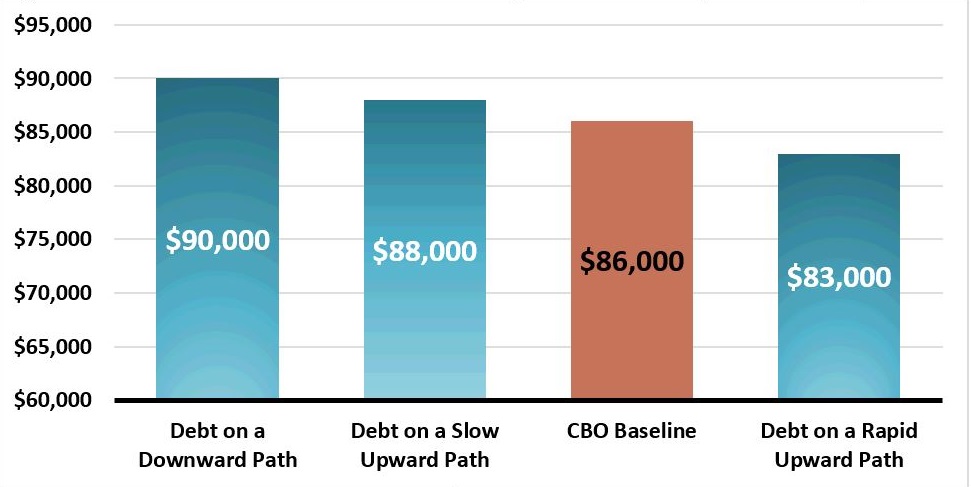
Beyond 2046, the negative consequences of high and rising debt will likely continue to grow larger over time. Further increases in the debt could worsen these consequences. For example, CBO finds an additional $2 trillion of non-interest spending or tax cuts over a decade would reduce per-capita GNP an additional $3,000 – with total real GNP 3 percent lower than baseline – by 2046.
Rising Debt Has Other Important Costs
In addition to slowing overall economic growth, the nation’s high and growing debt has a number of other consequences outlined by CBO.
First, rising debt could crowd out other important budget priorities. As interest rates normalize, growing debt will tend to lead to higher federal interest costs in two ways – by increasing the amount of debt interest is paid on and by increasing the interest rates themselves. For any given fiscal target, higher spending on interest will necessarily mean lower government benefits, fewer government services, higher taxes, or some combination.
Second, higher debt will reduce the government’s flexibility in responding to domestic or international problems such as a war or a recession. As CBO points out, during the great recession the debt-to-GDP ratio rose from below 40 percent of GDP to above 70 percent to accommodate automatic stabilizers, fiscal stimulus, and financial stabilization measures. A similar increase in debt would be both politically and economically more difficult if starting from debt levels already twice their historical average or more. In addition, CBO argues, “the reduced financial flexibility and increased dependence on foreign investors that would accompany high and rising debt could weaken U.S. leadership in the international arena.”
Finally, growing levels of debt increase the risk of fiscal crisis. In such a crisis, CBO explains:
“[…I]nvestors might become less willing to finance the government’s borrowing unless they were compensated with high interest rates. As a result, interest rates on federal debt would abruptly become higher than the rates of return on other assets, dramatically increasing the cost of future government borrowing. In addition, that increase would reduce the market value of outstanding government bonds. If that happened, investors would lose money. The potential losses for mutual funds, pension funds, insurance companies, banks, and other holders of government debt might be large enough to cause some financial institutions to fail, creating a fiscal crisis.”
Though no one can predict if and when such a crisis would occur, higher levels of debt make the odds of such a crisis more likely to occur and perhaps more difficult to combat.
Ultimately, projected deficit and debt levels are clearly on an unsustainable path, meaning tax increases and/or spending cuts will be needed at some point. If delayed, adjustments may be painful, abrupt, and recessionary. This is true in any case, but especially if such changes need to be made in the wake of a fiscal crisis.
The Cost of Waiting to Fix the Debt is High
Putting the debt on a sustainable path will require significant adjustments to spending, revenue, or more likely both. However, delaying action will dramatically increase the size of these necessary adjustments.
According to CBO, holding the debt-to-GDP ratio to its current high levels for the next three decades will require tax or spending adjustments (excluding interest) equivalent to 1.7 percent of GDP; reducing the debt to its 50-year historical average of 39 percent of GDP would require adjustments of 2.9 percent of GDP. For context, this is the equivalent of 8 to 14 percent of non-interest spending (and a similar share of revenue) and suggests ten-year non-interest savings or tax revenue of $4.0 to $6.7 trillion.
Fig. 5: Annual Non-Interest Spending Cuts or Revenue Increases Needed to Meet Fiscal Goal in 30 Years,
Depending on Start Date (Percent of GDP)
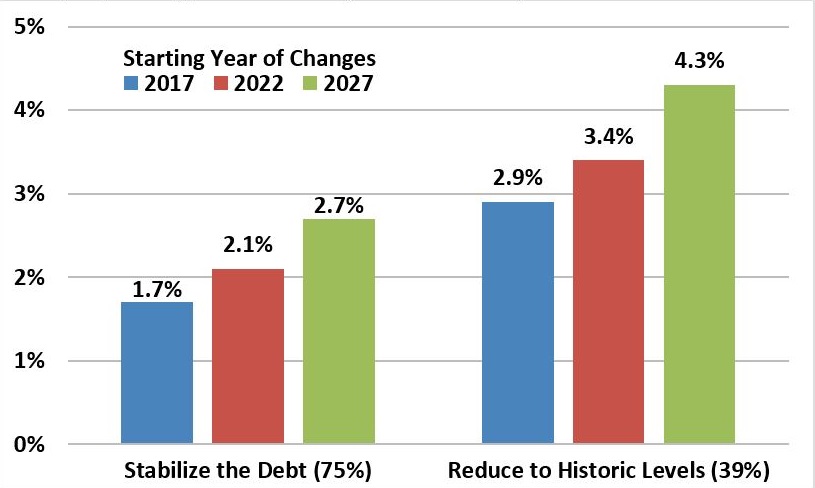
However, waiting to make tax or spending changes will significantly increase the annual cost of reforms. Waiting just five years to act would increase the size of the necessary adjustments by over a fifth, to between 2.1 and 3.4 percent of GDP, requiring non-interest spending cuts of 10 to 16 percent (or a similar increase in revenue) – the equivalent to $4.9 to $7.9 trillion over a decade.2 Waiting ten years, meanwhile, will increase the size of the adjustments to between 2.7 and 4.3 percent of GDP, requiring non-interest spending cuts of 13 to 21 percent (or similar revenue increases) – roughly the equivalent of $6.3 to $10.0 trillion over a decade.3
In other words, delaying changes for just ten years increases the size of the necessary adjustments to reach a given fiscal target by over 50 percent.
Delaying action on the debt will also leave lawmakers less time to phase policy in and provide households and businesses affected by any change less time to prepare and adjust.
Major Trust Funds are Heading Toward Insolvency
According to CBO, a number of major federal trust funds face exhaustion in the next decade and a half. The Highway Trust Fund is on course to be depleted by 2021 and the Social Security Disability Insurance Trust Fund by 2022. The Medicare Part A (Hospital Insurance) Trust Fund is projected to run out by 2026. And in 2030, the Social Security Old-Age and Survivors’ Insurance (OASI) will become insolvent.
Assuming continued reallocation between the two Social Security trust funds, CBO expects that on a combined basis they will be depleted in 2029, at which point benefits would have to be cut by 29 percent to bring the programs costs in line with dedicated revenues. For a typical 55-year old couple retiring at the normal age, that would mean a $13,300 cut in annual benefits the year after they retire.
For Social Security, avoiding insolvency over the next 75 years will require immediate adjustments equal to 1.6 percent of GDP, which is the equivalent of a 39 percent (4.8 percentage point) increase in the payroll tax rate or a 26 percent cut in benefits.
The same demographic factors driving up Social Security spending, along with continued growth in health costs, will also lead to significant shortfalls in Medicare’s Hospital Insurance. Though CBO no longer estimates the 75-year shortfall of that program, they do project the trust fund will run dry in 2026, at which point it would face a $62 billion deficit requiring a 12 percent across-the-board cut in payments.
In all cases, note that for the purposes of their overall budget numbers, CBO assumes that spending continues as scheduled regardless of trust fund reserves – in effect assuming transfers to each trust fund as necessary.
Fig. 6: What Will Happen to the Major Trust Funds
| Exhaustion Date | Annual Deficit in Exhaustion Year | Percent Cut at Insolvency | |
|---|---|---|---|
| Highway Trust Fund (combined) | 2021 | $19 billion (0.1% of GDP) | 32% |
| Medicare Hospital Insurance Trust Fund | 2026 | $62 billion (0.2% of GDP) | 12% |
| Social Security Disability Insurance Trust Fund | 2022 | $35 billion (0.2% of GDP) | 20% |
| Social Security Old Age & Survivors' Insurance Trust Fund | 2030 | $515 billion (1.5% of GDP) | 29% |
| Addendum: Theoretical Combined Social Security Trust Funds | 2029 | $560 billion (1.8% of GDP) | 29% |
Absent such a transfer, however, significant adjustments will be needed to ensure benefits can be paid for current and future generations. As with fixes to the overall debt, the sooner those adjustments are made the smaller and easier they will be.
Conclusion
CBO’s long-term outlook continues to show the federal government faces a clearly unsustainable long-term fiscal picture – with debt levels projected to grow even higher than in last year’s outlook. Under its Extended Baseline Scenario, CBO projects debt would continue to rise, surpassing its all-time record – set the year after World War II ended – sometime around 2035, and likely doubling as a share of the economy (from today’s already high levels) before 2050.
Rather than reverse this unsustainable course, some policymakers and candidates for office want to worsen it. Further increasing spending or reducing revenue without offsets would be a costly mistake. So too would ignoring the rapid growth of the nation’s entitlement programs, many of which are heading toward insolvency.
Instead, lawmakers should come together and work on a plan or plans to make Social Security solvent, slow the growth of federal health spending, and identify adequate revenue increases and spending cuts to ensure debt is on a sustainable long-term path. Such a plan would lead to slower debt growth and faster economic growth. Unfortunately, as CBO shows, our current course will lead to just the opposite.
1 Debt on a downward path=$4 trillion of ten-year deficit reduction, bringing debt to 55% of GDP in 2046. Debt on a slow upward path=$2 trillion of ten-year deficit reduction, bringing debt to 96% of GDP in 2046. CBO baseline=Debt at 141% of GDP in 2046. Debt on a rapid upward path=$2 trillion of ten-year deficit increases, bringing debt to 193% of GDP in 2046.
2 This number is illustrative; it represents non-interest spending reductions and/or revenue increases of the magnitude after the delay, applied every year over 2017-2026.
3 Ibid.


