22 Top Fiscal Charts of 2022
2022 was a busy year for fiscal policy, which gave us many opportunities to conduct substantive policy analysis using charts and tables. This year, we published over 200 papers, blog posts, and other products. As we get ready to pop the champagne and ring in the new year, here are our top fiscal charts of 2022.
1. The National Debt is High and Rising
In May, the Congressional Budget Office (CBO) projected that federal debt held by the public would rise from 98 percent of Gross Domestic Product (GDP) at the end of Fiscal Year (FY) 2022 to a new record of 108 percent by 2031 and 110 percent by 2032. Under an alternative scenario where policymakers extend most expiring tax cuts and grow annual appropriations with the economy rather than inflation, debt would reach 122 percent of GDP by 2032.

2. We Now Project Even Higher Debt
Since CBO released its latest ten-year baseline in May, we produced our own set of budget projections that account for the legislative and administrative changes enacted since CBO's baseline as well as economic and technical changes based on actual economic and fiscal data. Under our updated baseline, we estimate debt will reach 116 percent of GDP by 2032. We also produced two alternate scenarios that reflect the reality that the actual fiscal outlook could be far worse than our baseline suggests. Under our intermediate alternate scenario, we project debt would reach 129 percent of GDP by 2032. And under our high-cost alternate scenario, we estimate a debt-to-GDP ratio of 138 percent by 2032.

3. The CRFB Fiscal Blueprint Would Stabilize Debt
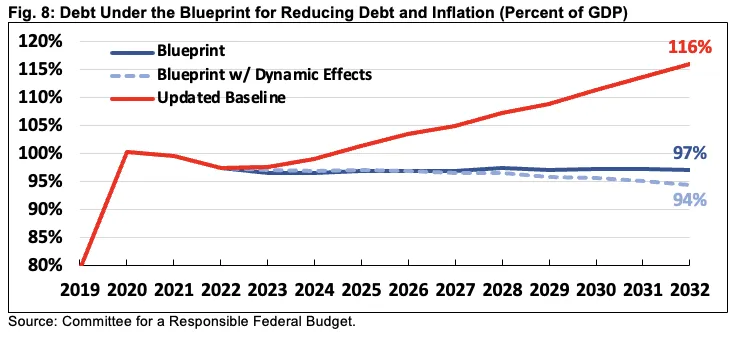
In October, we published "The CRFB Fiscal Blueprint for Reducing Debt and Inflation" that puts forward a framework to stabilize debt at its current level within a decade through roughly $7 trillion of savings from revenue and spending changes. Under the blueprint, debt would remain stable at below 98 percent of GDP over the decade, ultimately falling to 97 percent of GDP by 2032 and continuing to decline thereafter. Assuming the blueprint leads to modestly stronger economic growth, lower inflation, and lower interest rates, debt would fall further to 94 percent of GDP by 2032.
4. Any Budget Plan Should Focus on Achieving Fiscal Sustainability
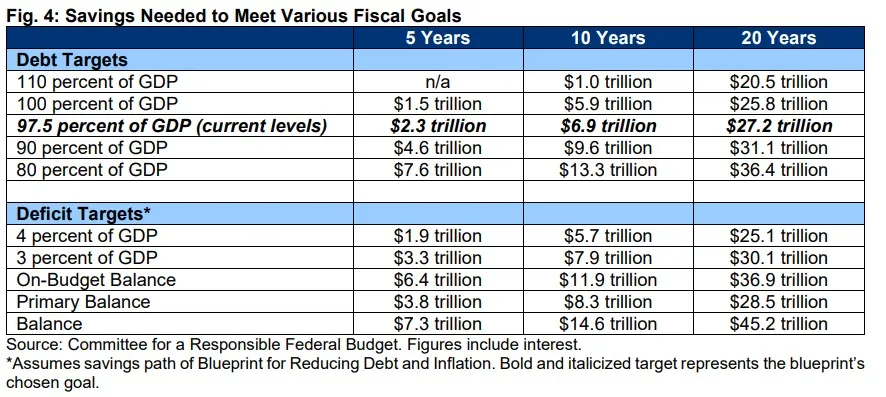
While there is no one right way to measure fiscal sustainability, it is helpful to set a specific fiscal goal and then put forward tax and spending plans to see that goal. In "The CRFB Fiscal Blueprint for Reducing Debt and Inflation," we outline the savings needed to achieve a variety of debt-to-GDP and deficit targets. As examples, stabilizing the debt at its current level would require $6.9 trillion of savings over ten years, while reducing debt to 80 percent of GDP would require $13.3 trillion of savings.
5. The Budget Deficit Totaled $1.4 Trillion in FY 2022
The FY 2022 deficit totaled $1.4 trillion. The actual FY 2022 deficit was $339 billion higher than the $1.0 trillion deficit CBO projected in its May baseline and well above pre-pandemic levels but $1.4 trillion below the FY 2021 deficit of $2.8 trillion.

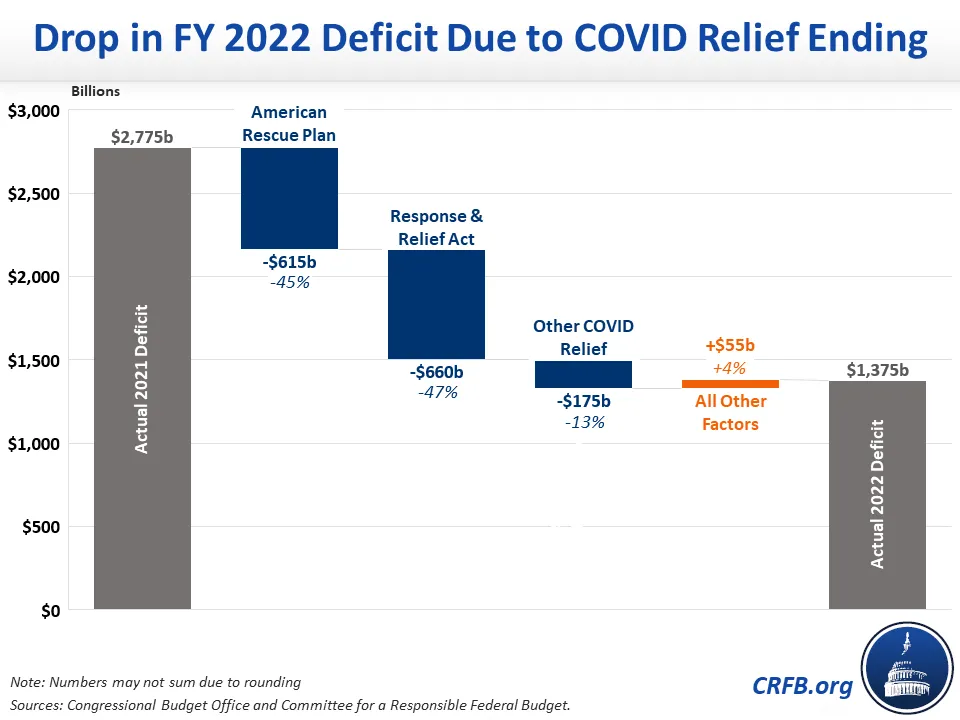
6. COVID Relief Explains All of FY 2022 Deficit Decline
The budget deficit fell from $2.8 trillion in FY 2021 to $1.4 trillion in FY 2022. While the Biden Administration has tried to take credit for this "historic deficit reduction," over 100 percent of the decline was the result of shrinking or expiring COVID relief. Higher deficits from the cancellation of up to $20,000 per borrower of student debt, economic changes since CBO's February 2021 baseline, and other factors partially offset the decline.
7. Interest Payments Will Rise to Record Levels
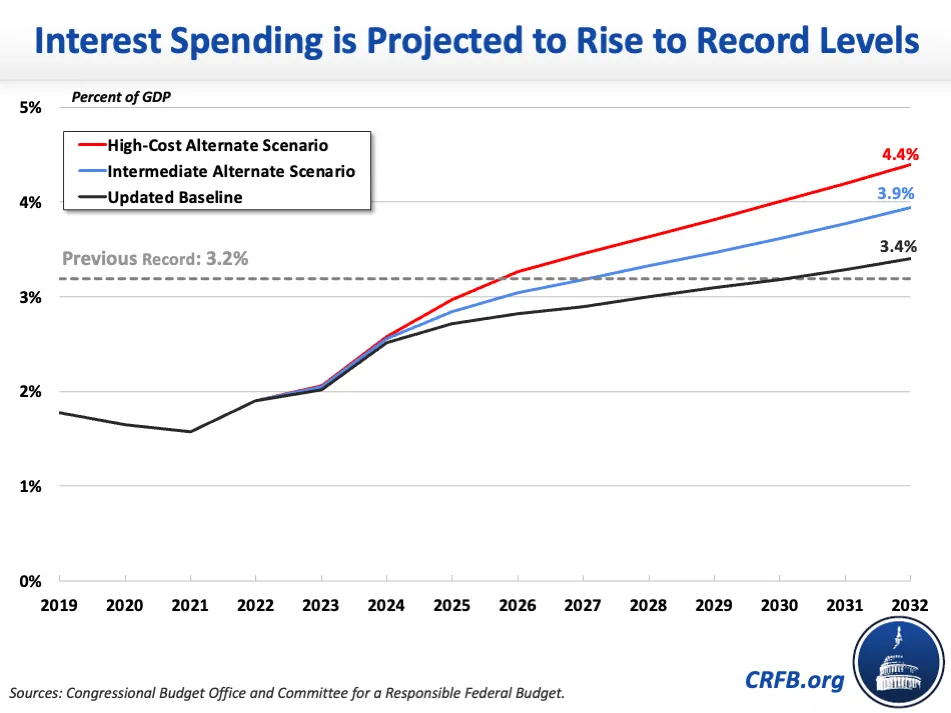
In May, CBO projected that interest costs would reach a record 3.3 percent of GDP by 2032, exceeding the prior record of 3.2 percent of GDP set in 1991. Our updated baseline projects that interest costs will reach 3.4 percent of GDP by 2032 or as high as 4.4 percent in our high-cost scenario.
8. The Biden Administration Has Approved $4.8 Trillion of New Borrowing
Since January 2021, the Biden Administration has enacted policies through legislation and executive actions that will add more than $4.8 trillion to budget deficits between 2021 and 2031. The $4.8 trillion is the net result of roughly $4.6 trillion of new spending, about $500 billion of tax cuts and tax breaks, and $700 billion of additional interest costs that are partially offset by $400 billion of spending cuts and $600 billion of revenue increases.

9. Social Security is Only 13 Years from Insolvency
According to the Social Security Trustees, the Social Security Old-Age and Survivors Insurance (OASI) trust fund will deplete its reserves by 2034 and the Social Security Disability Insurance (SSDI) trust fund will remain solvent through the 75-year projection window. The theoretically combined trust funds will exhaust their reserves by 2035 (CBO projects OASI insolvency in 2033, SSDI insolvency in 2048, and combined insolvency in 2033). At that point, benefits will be immediately reduced by 20 to 23 percent.

10. The Labor Market Has Changed a Lot Since Before the Pandemic
According to the most recent data from the Bureau of Labor Statistics, the U.S. has created over one million jobs since February 2020. This is the net effect of nearly 1 million job losses in leisure and hospitality and 700,000 job losses in government and other industries, offset by over 1 million job gains in the professional and business industry, 700,000 gains in the transportation and warehousing industry, and another 1 million jobs spread over most remaining industries.

11. Inflation is at a 40-Year High
The Consumer Price Index (CPI) is up 7.1 percent from one year ago and the Personal Consumption Expenditures (PCE) Price Index is up 5.5 percent. Neither index has grown that fast since 1982 and 1983, respectively. Last year, CPI grew by 6.7 percent and PCE by 5.6 percent. The Federal Reserve typically targets 2.0 percent PCE inflation, which is the equivalent of 2.3 percent CPI inflation.
Although the Federal Reserve is chiefly in charge of supporting price stability, we've shown, that fiscal policy can help the Federal Reserve fight inflation and reduce the likelihood of a resulting deep recession.

12. Making Trust Funds Solvent Would Reduce Debt Growth
In its July 2022 Long-Term Budget Outlook, CBO projected debt would reach 185 percent of GDP by 2052. These projections assume current law spending on Social Security, Medicare, and highways continues after these programs' respective trust funds deplete their reserves. Our TRUSTGO baseline, which assumes no new trust fund borrowing is allowed either through solvency being achieved or lawmakers allowing cuts to take place, would slow the growth of debt to 136 percent of GDP by 2052. A set of pro-growth reforms could reduce debt to a low as 110 percent of GDP by 2052.

13. Inflation Reduction Act Would Produce Long-Term Deficit Reduction
The Inflation Reduction Act (IRA) will reduce budget deficits by $1 trillion, including interest savings, over two decades. We estimated that an earlier version of the IRA would reduce deficits by $1.9 trillion over two decades, including interest. However, the final version of the legislation included a delay of implementation, instead of a repeal, of the Trump Administration's drug rebate rule, among other changes, which led us to revise our two-decade savings estimates downward. We have advocated for cancelling the drug rebate rule administratively so additional savings would be realized.

14. The Inflation Reduction Act Will Reduce National Health Expenditures
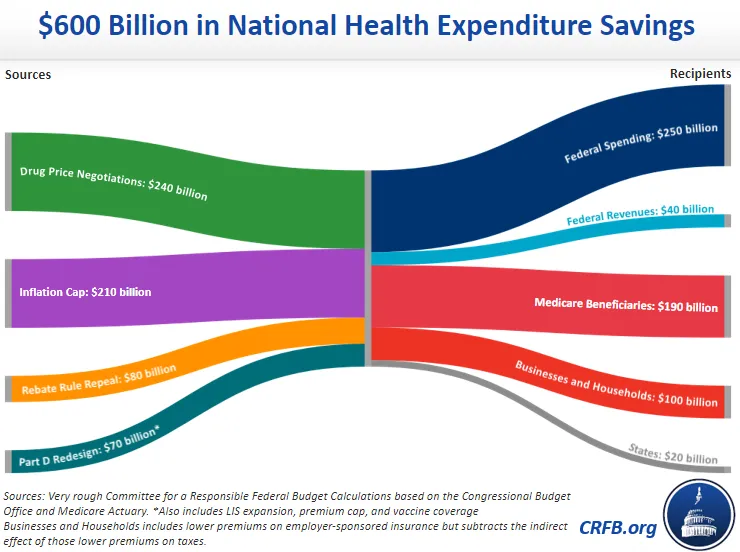
The IRA included three major policies to lower prescription drug costs, including allowing Medicare to negotiate select prescription drug prices, limiting drug price growth to inflation, and delaying implementation of the Trump-era drug rebate rule. We estimated an earlier version of the IRA (which included full repeal of the rebate rule) would reduce National Health Expenditures (NHEs) by roughly $600 billion through 2031. The reduction in NHEs from the final legislation is likely less than $600 billion.
15. Student Debt Changes Wipe Out Inflation Reduction Act Savings
The Biden Administration's student debt cancellation and relief measures will cost as much as the first 16 years of deficit reduction ($570 billion) from the IRA on a nominal basis and the first 21 years of savings ($580 billion) on a present value basis.

16. President Biden's Debt Cancellation Plan is Regressive
In August, President Biden announced his plan to extend the student loan repayment pause through the end of this year (later extended again – see #17) and to cancel $10,000 to $20,000 per borrower of student debt. These policies are regressive, and we estimate they will deliver 57 percent to 65 percent of the benefit to those in the top half of the income spectrum.

17. Student Loan Repayment Pause Means Big Debt Cancellation for Doctors
In August, the Biden Administration announced an extension of the student loan repayment pause until December 31 of this year (it has since extended the pause to the sooner of 60 days after resolution of the student debt cancellation litigation or 60 days after June 30, 2023). The benefit of the pause accuses disproportionately to those with advanced degrees - we estimated an extension of the pause through the end of 2024 would effectively cancel $107,000 of student debt for doctors compared to $10,000 for Bachelor's degree recipients.

18. The U.S. Has a Large Tax Gap
Every year, a large share of taxes owed is never paid. This year, the Internal Revenue Service (IRS) released an updated tax gap analysis, which showed the tax gap grew over time but shrunk as a share of taxes owed. Over the 2017 to 2019 period, the gross tax gap totaled $540 billion, compared to $438 billion between 2011 and 2013. The Inflation Reduction Act provided $80 billion of increased IRS funding to improve tax compliance, reflecting a priority of the Biden Administration to tackle the tax gap. In fact, every President since Ronald Reagan has put forth proposals to close the tax gap and improve taxpayer compliance.

19. Tax Expenditures Are Extremely Costly
This year, CBO published a report on the budgetary and distributional effects of the major tax expenditures in 2019, showing that many are costly and regressive. The tax expenditures CBO analyzed cost the federal government $1.2 trillion in 2019, with the largest expenditures come from the exclusion of employer health insurance and various retirement savings preferences. We estimate total tax expenditures cost $1.6 trillion in 2019.

20. A Carbon Tax Can Raise Revenue and Reduce Greenhouse Gas Emissions
In a recent paper, "Can a Carbon Tax Fund Climate Investments?," we found that a $20 to $40 per-metric-ton carbon tax, indexed to grow 1 percent to 5 percent faster than inflation annually, would raise $650 billion to about $1.6 trillion of new revenue over ten years and reduce greenhouse gas emissions by 14 percent to 21 percent in 2030. If used to fund new climate spending and tax credits, we estimated the larger carbon tax could generate $900 billion of net deficit reduction and reduce emissions by 30 percent by 2030 – within spitting distance of the Paris Agreement target.

21. Medicare Advantage Enrollment Will Grow
Nearly half of all Medicare beneficiaries are now enrolled in Medicare Advantage (MA) as opposed to traditional Medicare. Soon, the majority of beneficiaries will be in Medicare Advantage. While these private plans are in some ways more generous and efficient than traditional Medicare, they are also much more costly to the federal government. Reforms to the Medicare Advantage program could save the government hundreds of billions of dollars.

22. You Can Continue to Track COVID Relief Dollar by Dollar
Throughout 2022, we continued to update our interactive COVID Money Tracker Tool. At COVIDMoneyTracker.org, users can follow every major action taken by Congress, the Administration, the Federal Reserve, and various federal agencies in response to the COVID-19 pandemic. Legislatively, Congress has allocated roughly $6.0 trillion for COVID relief, of which $5.5 trillion has already been committed or spent.

