Tax Day 2014: Ten Charts to Explain our Federal Tax System
In honor of tax day, CRFB released its Tax Day 2014 chartbook yesterday, with ten charts (and one table) that explain federal taxes – who pays them, what they pay for, and how they are collected.
 While CBO projects that our fiscal situation will continue to deteriorate in the coming years, Congress may decide to make the situation worse by renewing a host of temporary and expired tax provisions without offsetting their cost. Fundamental tax reform that simplifies the tax code, encourages growth and raises revenue could go a long way in closing the gap between spending and revenues and putting debt on a sustainable path.
A PDF version of our chartbook is available here. The individual charts are posted below with their descriptions. This in addition to our long list of other tax resources, such as the "Tax Break-Down" series that examines each tax break in detail, blog posts on the tax extenders, a resource page on commonly discussed tax reform plans, and an analysis of Chairman Camp's recent draft to overhaul the tax code.
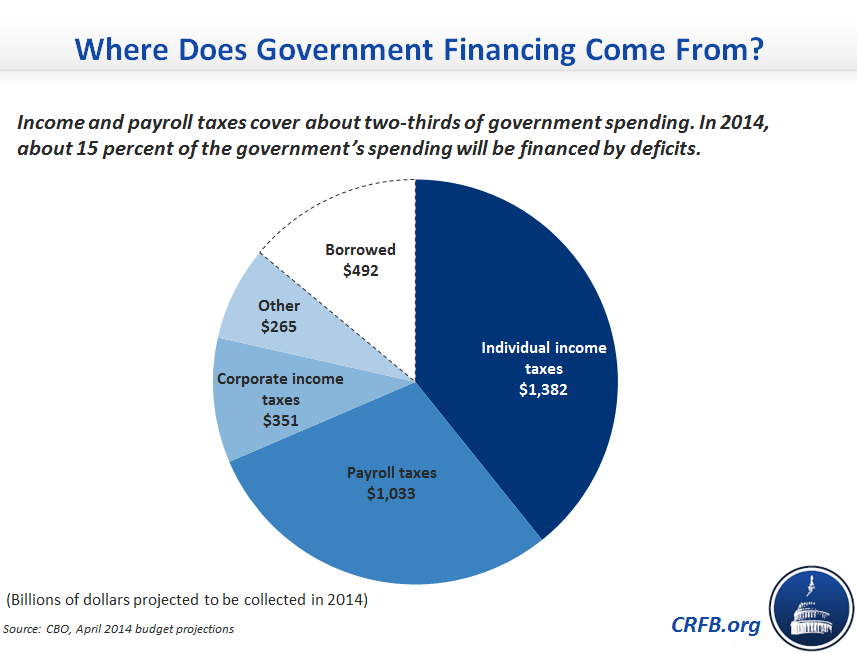
Chart 1: Where Does Government Financing Come From?
CBO’s latest baseline estimates that the federal government will collect just over $3 trillion in 2014, while federal outlays will be about $3.5 trillion. Income and payroll taxes cover about two-thirds of federal spending, with corporate income and other taxes covering another 17 percent. About 15 percent of federal spending in 2014 will be financed by deficits.
 Tweet This Chart
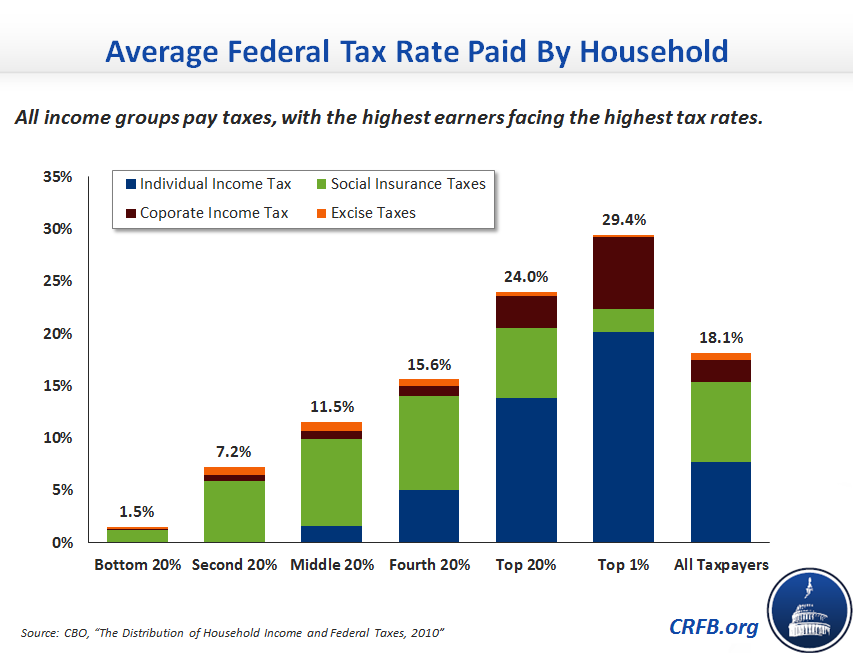
Chart 2 & 3: Who Pays Taxes, And How Much?
As our next chart shows, all income groups pay federal taxes, with the highest earners paying the highest tax rates. While the bottom 40 percent of taxpayers on average receive money back from the income tax, they pay a larger share of their income in payroll and excise taxes than upper-income taxpayers. On average, all households outside the top 20 percent pay more in payroll taxes than they do in income taxes.
The top 20 percent of households pay almost 70 percent of federal taxes, with the top one percent of earners paying nearly one-quarter. This reflects both the distribution of income and the progressive nature of the current tax code: in 2010, households in the top income quintile received 52 percent of before-tax income and paid about 69 percent of federal taxes, while households in the bottom quintile received 5 percent of before-tax income and paid 0.4 percent of taxes.
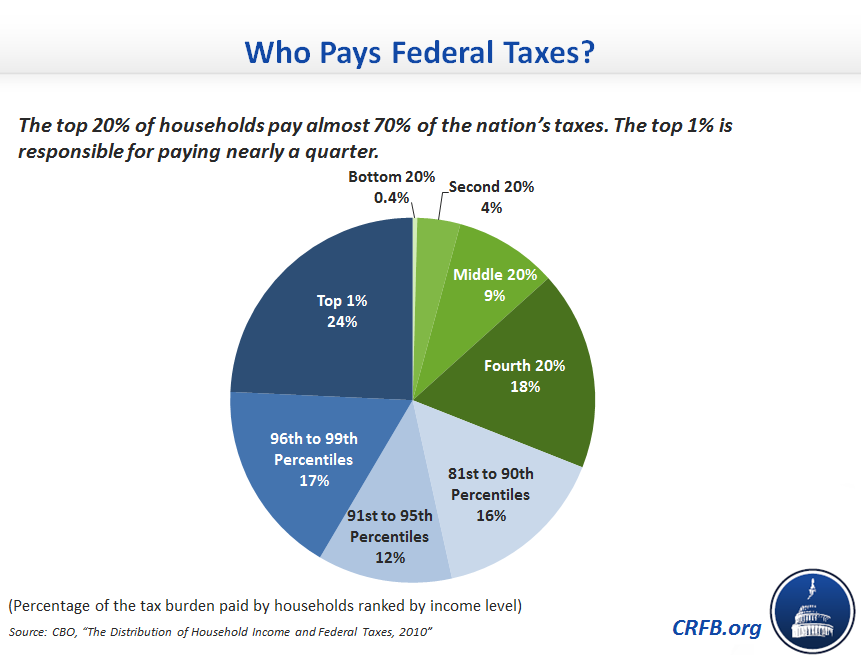
Chart 4: Revenues Are Insufficient for Current Levels of Spending
Since 1980, revenues have averaged about 17.4 percent of GDP, while spending has averaged about 20.4 percent of GDP. Yet the aging of the population and growth in mandatory spending programs are set to push federal expenditures well above their historical average. While revenues are projected to increase in the years ahead (assuming lawmakers allow a number of tax provisions to expire, or offset their cost), the government will still have to rely heavily on deficit financing to meet its current spending obligations.
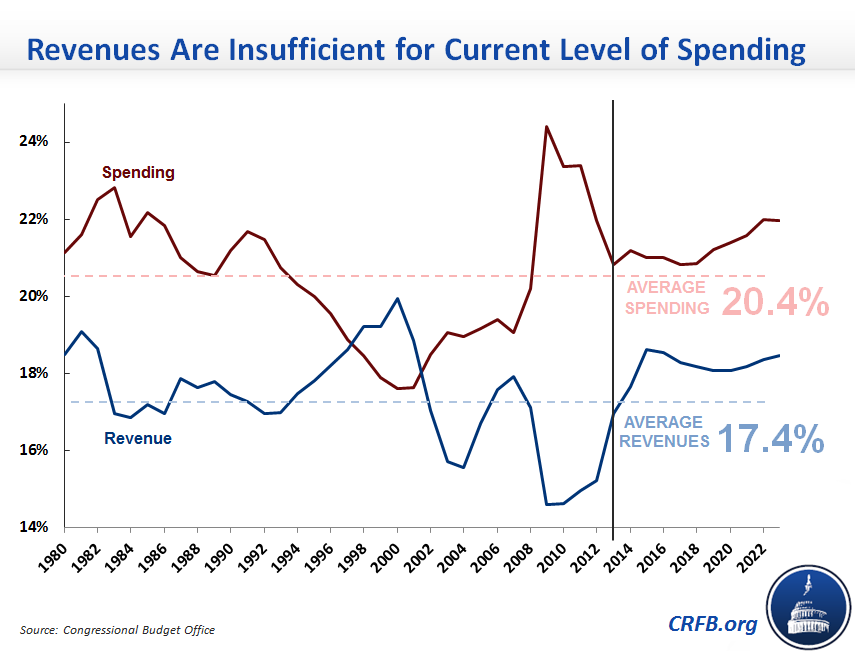
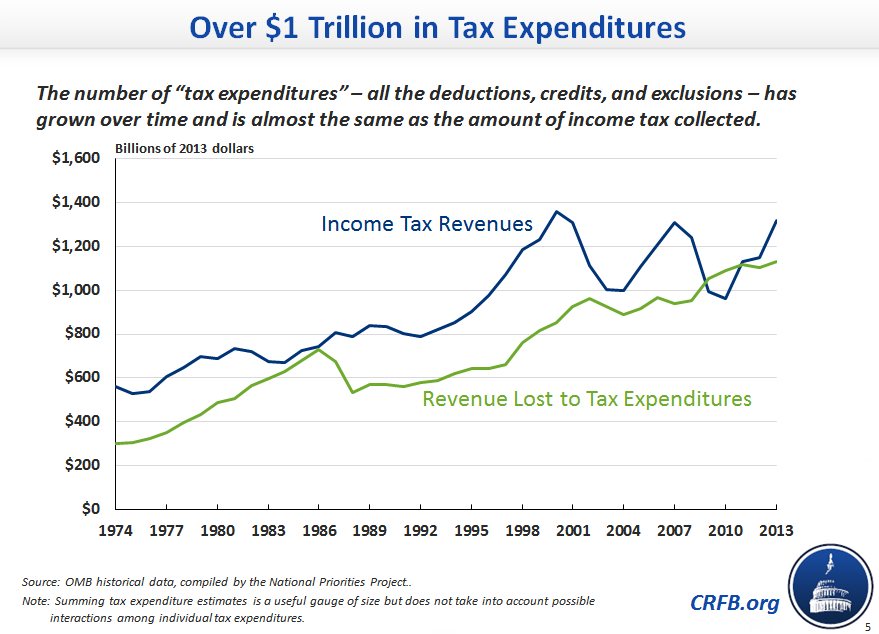
Chart 5, 6, & 7: The Cost of Tax Expenditures Has Grown Substantially
The number of “tax expenditures” – the various deductions, credits, exclusions and other tax breaks in the current code – has grown over time, actually exceeding the amount of income tax revenue collected in some years. Last year, the federal government lost at least $1.1 trillion in revenue due to tax expenditures. (The two offices who estimate tax expenditures use different totals. The Office of Management & Budget calculated over $1.1 trillion of tax expenditures. The Joint Committee on Taxation uses different lists and estimates and found almost $1.3 trillion in tax expenditures.)
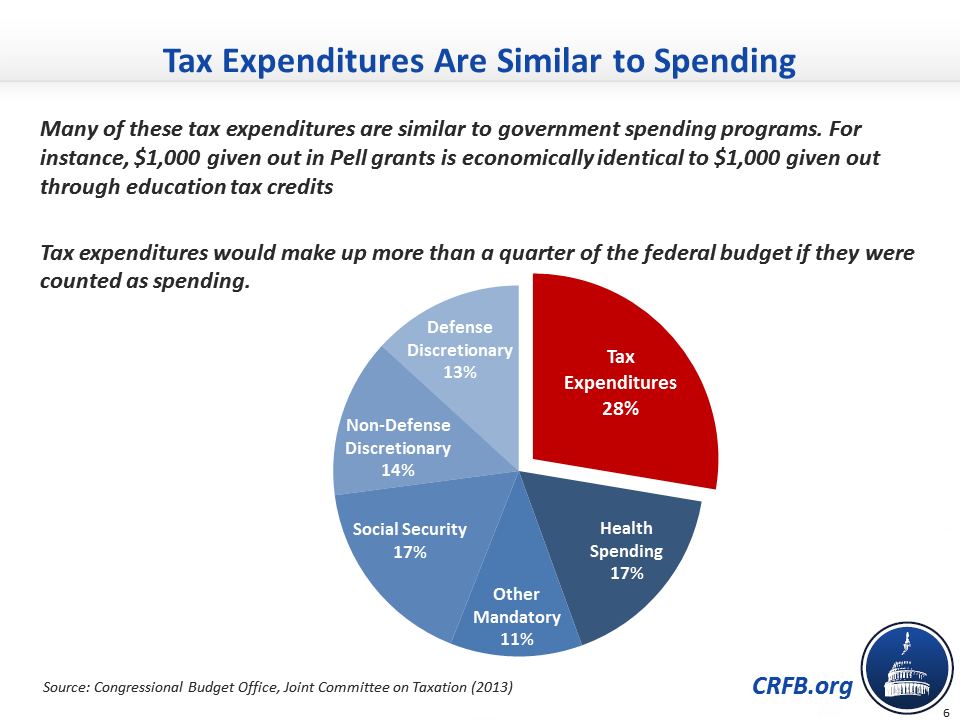
Many of these tax expenditures are similar to government spending programs. For example, spending $1,000 in the form of a Pell grant is economically indistinguishable from giving out $1,000 through refundable education tax credits. This leads many commentators to refer to most tax expenditures as “spending through the tax code” that obscures the true size of government. If tax expenditures were counted as ordinary spending, they would comprise about 28 percent of the federal budget.
In fact, some tax expenditures are larger than similar spending programs. In fiscal year 2012, the federal government lost more revenue due to the mortgage interest deduction (intended to encourage home ownership) than the entire budget for the Department of Housing and Urban Development. Refundable credits, like the Earned Income Tax Credit and the Child Tax Credit, serve as some of the biggest anti-poverty programs, costing nearly double the amount spent on cash aid to impoverished families.

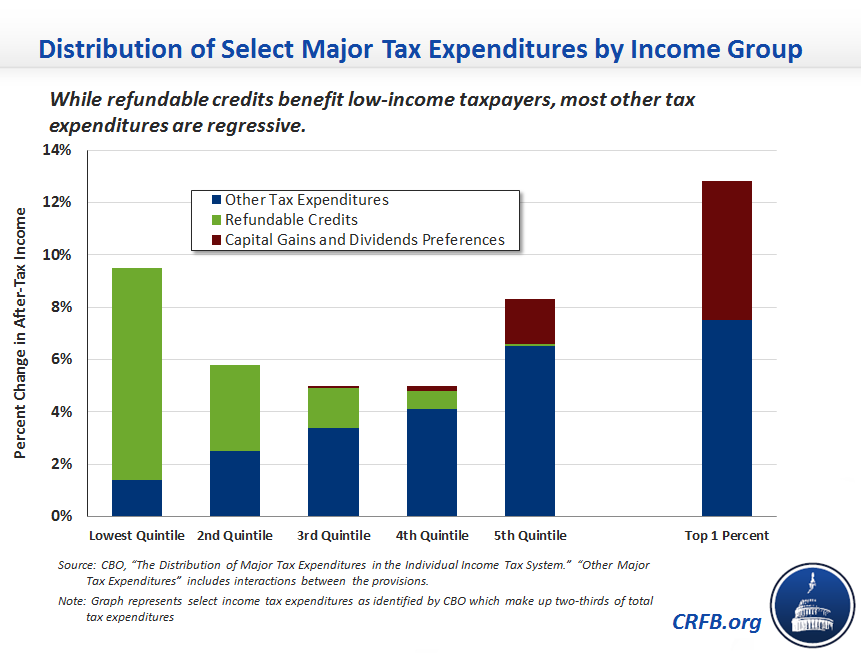
Chart 8: These Tax Expenditures Are Regressive
Aside from refundable credits, most tax expenditures disproportionately benefit high-income taxpayers. Ten of the largest tax expenditures identified by CBO increase the after-tax income of the top 1 percent of earners by 13 percent, with the preferential tax rates for capital gains and dividends alone representing more than 5 percent of after-tax income.
You can read more about some of the largest tax expenditures in the current code by checking out our Tax Break-Down series, which analyzes individual tax provisions and reviews how much they cost, who they benefit, and how they can be reformed.
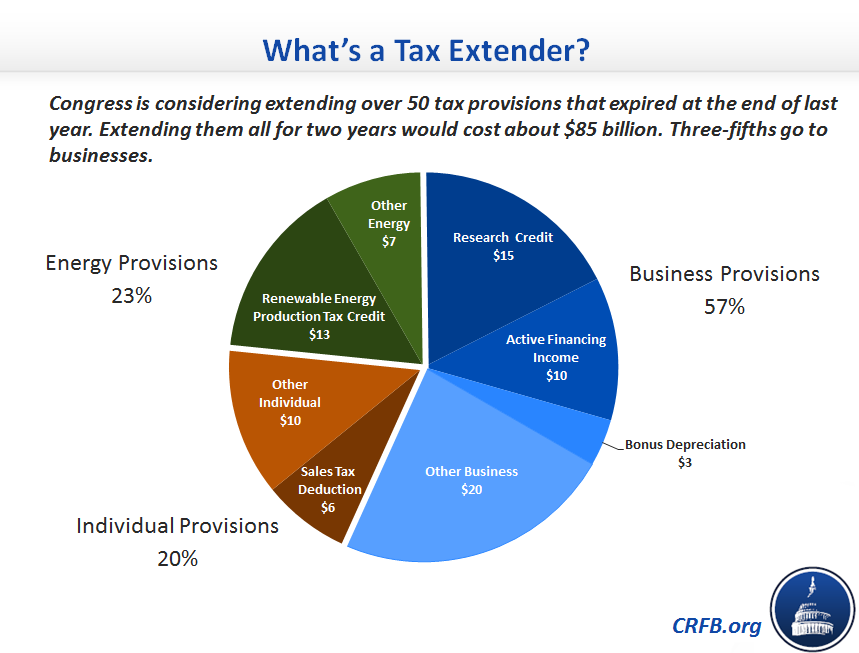
Chart 9 & 10: What Are The Tax Extenders and How Much Do They Cost?
Congress is currently considering extending over 50 tax provisions that expired at the end of last year. These “tax extenders” are frequently renewed by Congress and are sometimes revived retroactively. Extending all of these provisions for two years would cost roughly $85 billion. About 57 percent of the tax extenders go to businesses, with the research and experimentation credit being the most expensive.
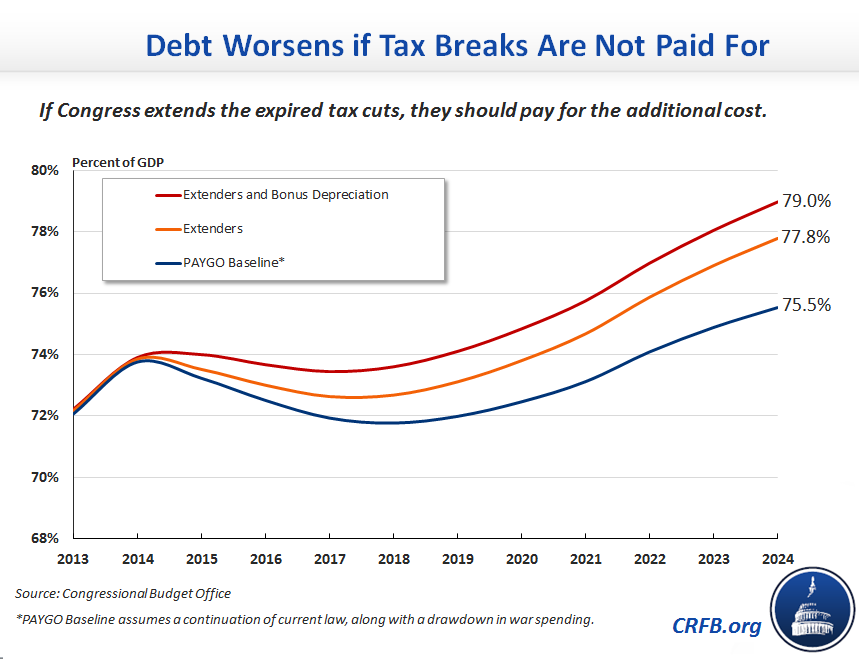
The $85 billion two-year cost to extend all of these provisions is somewhat deceptive, particularly because one of them, bonus depreciation, costs far more to extend permanently than to extend temporarily. If lawmakers continue the current practice of extending all the provisions year after year, they would cost approximately $750 billion (or almost $930 billion with interest) over the next ten years, which would increase debt as a share of GDP from 75.5 percent to 79 percent in 2024. Extending the temporary “bonus depreciation” introduced as a stimulus measure in 2008 accounts for one percentage point of that increase.
And One Table: The Taxpayer Receipt
Our last chart shows where an illustrative taxpayer's money goes. The majority of tax dollars go towards popular functions like national defense, Social Security, and Medicare. Functions like foreign aid and federal employee retirement benefits comprise a relatively small share of the federal budget. For every $100 paid in taxes, more than $6 goes to paying interest payments on the debt. Importantly, taxpayers would have to pay an additional $24.50 for every $100 they paid in taxes in order to pay for all federal spending in 2013.

Now that we've all paid our taxes, it is worth remembering the basic facts about our current income tax system. As lawmakers consider whether to overhaul the current tax code, it is important to recognize the tough choices and trade-offs necessary for any meaningful tax reform.

