Subject to Change: How Different Parameters Could Affect Long-Term Debt
Underlying the Congressional Budget Office's (CBO) 30-year budget projections are a series of economic and demographic assumptions that are critical to the agency's deficit and debt numbers. These assumptions are uncertain enough after only a few years, so they can diverge significantly from CBO's baseline assumptions over three decades. Luckily, CBO also shows how federal debt would change if some parameters performed differently from its intermediate assumptions.
One of the biggest sources of uncertainty that we have already discussed is future policy, or the possibility that lawmakers could enact policies different from the ones CBO assumes in its current law baseline. For example, if they extend temporary tax policies and repeal the sequester, debt would be 160 percent of GDP in 2046 instead of 140 percent. If lawmakers also keep certain areas near their historical averages as a share of GDP, debt would be even higher at 205 percent in 2046. On the flip side, if policymakers made trust funds solvent, debt would be nearly stable over the next 30 years at 75 percent.
In addition to policy scenarios, CBO demonstrates what would happen to debt if four different variables were different.
Labor Force Participation
The decline in the labor force participation rate (LFPR) in recent years has been a mystery for economists to dissect. The rate has fallen from 66 percent prior to the Great Recession to 62.7 percent in June 2016. While an aging population explains part of the decline, it does not explain the 2 percentage point decline among workers age 25 to 54 over the same period. CBO expects the LFPR for the overall population to fall further to 59 percent by 2046 largely due to population aging and increased marginal tax rates reducing the incentive to work. However, the participation decline among prime-age workers leaves some uncertainty as to how much of that decline is temporary and how much will continue into the future.
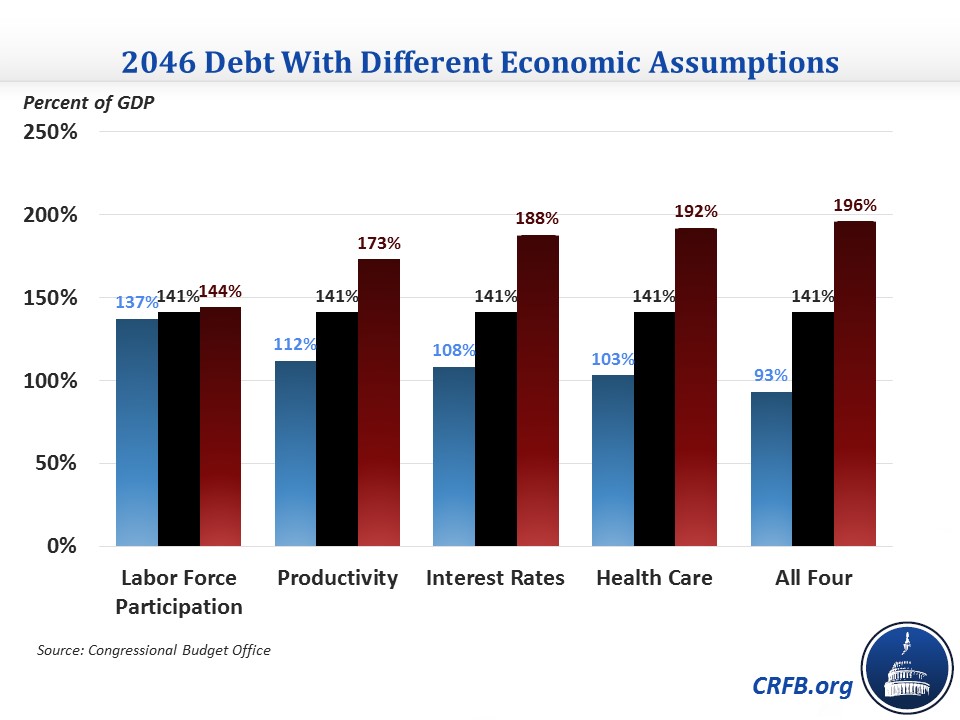
To demonstrate the effects of this uncertainty about labor supply responses to fiscal policy, CBO models two different scenarios where the LFPR is on average 2 percentage points higher or lower over the next 30 years and 3 percentage points higher or lower by 2046. These different scenarios have a relatively small effect on debt: it would be 137 percent of GDP in 2046 if the rate were higher and 144 percent if the rate were lower, compared to 141 percent under current law.
Productivity
The slowdown in productivity in recent years is another economic mystery, as potential total factor productivity (TFP) -- productivity when the economy is at full capacity -- has grown by only 0.8 percent per year since 2008 compared to 1.5 percent since 1950. Productivity is also difficult to forecast as unforeseen or even unexplained developments could lead productivity growth to suddenly accelerate or slow down, as it has a few times in the past. CBO projects that TFP growth will average 1.3 percent over the next 30 years.
To incorporate different productivity estimates, CBO shows how debt would change if productivity growth -- and in essence economic growth -- were 0.5 percentage points higher or lower, roughly corresponding to the range of 30-year averages of productivity growth since 1950. In the optimistic scenario, debt would be 112 percent of GDP in 2046, while it would be 173 percent in the pessimistic scenario, roughly a 30 percentage point difference from current law in both directions. CBO notes that these numbers could vary depending on how changes in productivity growth affect the share of income going to labor and capital, though this effect would likely be less than the effect of the change in productivity.
Interest Rates
By historical standards, interest rates on federal debt have been very low in recent years and in fact longer-term Treasury rates hit all-time lows last month in the Brexit aftermath. CBO does not expect these low rates to continue, with the average interest rate on federal debt rising from 1.9 percent this year to 3.8 percent by 2026 and 4.4 percent by 2046. Interest rates have remained lower for longer than CBO thought at the beginning of the recovery (and they continue to be lower than CBO expected this year) so it is possible that interest rates could be lower than CBO's intermediate scenario. At the same time, rising debt could drive interest rates higher than CBO expects.
If interest rates were 1 percentage point higher or lower (or about 1.2 percentage points different after accounting for economic feedback), it would make a sizeable difference for long-term debt. Public debt would be 108 percent of GDP in 2046 on the optimistic side and 188 percent on the pessimistic side compared to the 141 percent in the intermediate scenario.
Medicare/Medicaid Spending
Health care spending growth is another particularly uncertain area, as the question of how much of the health care slowdown of recent years will persist is yet to be answered. Excess cost growth, or the amount that the per-beneficiary spending growth rate exceeds per-person GDP growth, is expected to be under 1 percent per year for both programs in the near term and eventually rise to 1 percent by 2046. If excess cost growth were 1 percentage points different each year, debt would vary significantly from the intermediate scenario. 1 percent slower cost growth each year would result in debt of 103 percent of GDP in 2046, while 1 percent faster growth would raise debt to 192 percent.
Combining Scenarios
It is also quite possible that multiple parameters could differ from CBO's intermediate assumptions in ways that are favorable or unfavorable to federal debt. CBO shows an optimistic and pessimistic scenario that uses all four parameters, though with only 60 percent of the range used for each individual parameter to reflect the fact that some of them may be in conflict with each other (i.e. higher productivity growth would tend to raise interest rates). In the optimistic scenario -- where labor force participation is 2 percentage points higher in 2046, productivity growth is 0.3 percentage points higher, interest rates are 0.6 percent lower, and Medicare/Medicaid growth is 0.6 percent lower -- debt would rise much less gradually than under current law, from 75 percent of GDP this year to 93 percent by 2046. In the pessimistic scenario, where the inverse of all of these is true, debt would reach 196 percent in 2046.
These four parameters generally have the largest effect on the federal budget, but they are not the only variables that could cause changes. Increases in birth or immigration rates above what CBO expects would generally help the budget while decreases in mortality would tend to worsen debt, particularly over the long term. CBO also assumes that income distribution will stay unchanged after the first decade; if that does not hold up, it could affect the budget though CBO is not certain of the direction. There are also unexpected events -- severe recessions, disasters, credit program losses, and wars -- that tend to have more temporary effects on the budget but could still have a sizeable impact on the debt.
Dealing With Uncertainty
CBO also discusses ways to deal with budget uncertainty. Most importantly, having a lower level of federal debt "would give future policymakers more flexibility in responding to extraordinary events" by leaving more breathing room if that event required a significant federal response. Have more fiscal space would also provide more room for error if long-term economic conditions turn out to be worse than expected. Beyond reducing debt, policymakers could take several steps to protect the budget from changes in demographic or economic variables. For example, they could index retirement ages to life expectancy to protect against the long-term fiscal effects of decreasing mortality rates. Lawmakers could limit Medicare and Medicaid spending to a certain growth rate (as the Independent Payment Advisory Board does for Medicare) to guard against higher excess cost growth. They could also lengthen the average maturity of Treasury debt to better protect against interest rate increases, an action the Treasury Department has already undertaken by lengthening average maturity of Treasuries by about a year above its pre-recession level.
*****
The alternate scenarios CBO provides give a good idea of how much projections would change with different or unexpected developments. Importantly, CBO's numbers show that even if several things go right economically over the next 30 years, debt would still be on an upward path. Lawmakers certainly should not count on that though; instead, they should make the changes necessary to ensure debt doesn't rise over the long term.