The President's Budget in 8 Charts (FY2016 Edition)
In addition to a paper and blog series on the President's budget, CRFB has created a number of tables, graphs, and charts focused on specific aspects of the budget.
Today we released a full chartbook on the President's budget. Select charts are below, with more detailed descriptions.
Chart 1: Debt to GDP under the President's Budget
Based on its own projections, the President's FY2016 budget would roughly stabilize and slightly reduce debt levels as a share of GDP. Debt would fall from 74 percent of GDP today and 75 percent in 2015 to about 73 percent of GDP by 2025. Preventing the increases in debt projected under current law is an important accomplishment. However, debt under the President's budget would remain higher than any time other than World War II, and should be reduced further to ensure a sustainable fiscal path.

 Tweet This Chart
Chart 2: Important Budget Metrics in the President's Budget
Under the President's budget, deficits would remain relatively stable as a share of GDP over the decade – about 2.5 percent each year. These stable deficits are the result of increasing both spending and revenue at the same time. Revenues under the President's budget would rise from 18.7 percent of GDP in 2016 to 19.7 in 2025 while spending would rise from about 21.3 percent to 22.2. Both spending and revenue would also be higher under the President's budget than current law.

Chart 3: Costs and Savings in the President's Budget
Depending how it is measured, the President's budget includes between $1 and $1.8 trillion of new spending and tax breaks. At the same time, the budget follows the important principle of PAYGO, and more than fully offsets these new initiatives with over $2.6 trillion of tax increases, spending cuts, and other savings. Including interest, the budget saves $1.8 trillion relative to its own baseline, and about $900 billion relative to current law, excluding the war drawdown.
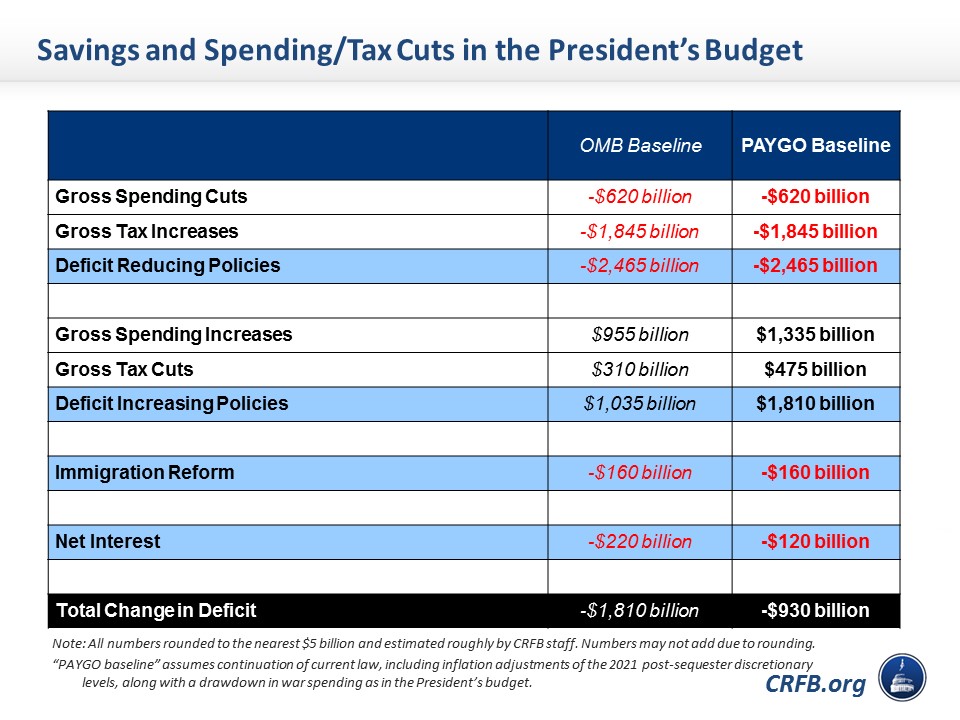
Chart 4: The Difference Between Savings Estimates
The President’s budget claims $1.8 trillion of deficit reduction over 10 years. However, some of these savings only count because they are measured against OMB's generous baseline. Effectively, the President’s savings estimates don’t account for the cost of extending “doc fixes,” continuing expiring refundable credits, or repealing the mandatory spending sequester. In addition, the budget counts increases in discretionary spending after 2021 as reduction by assuming a large one-time spending increase in their baseline
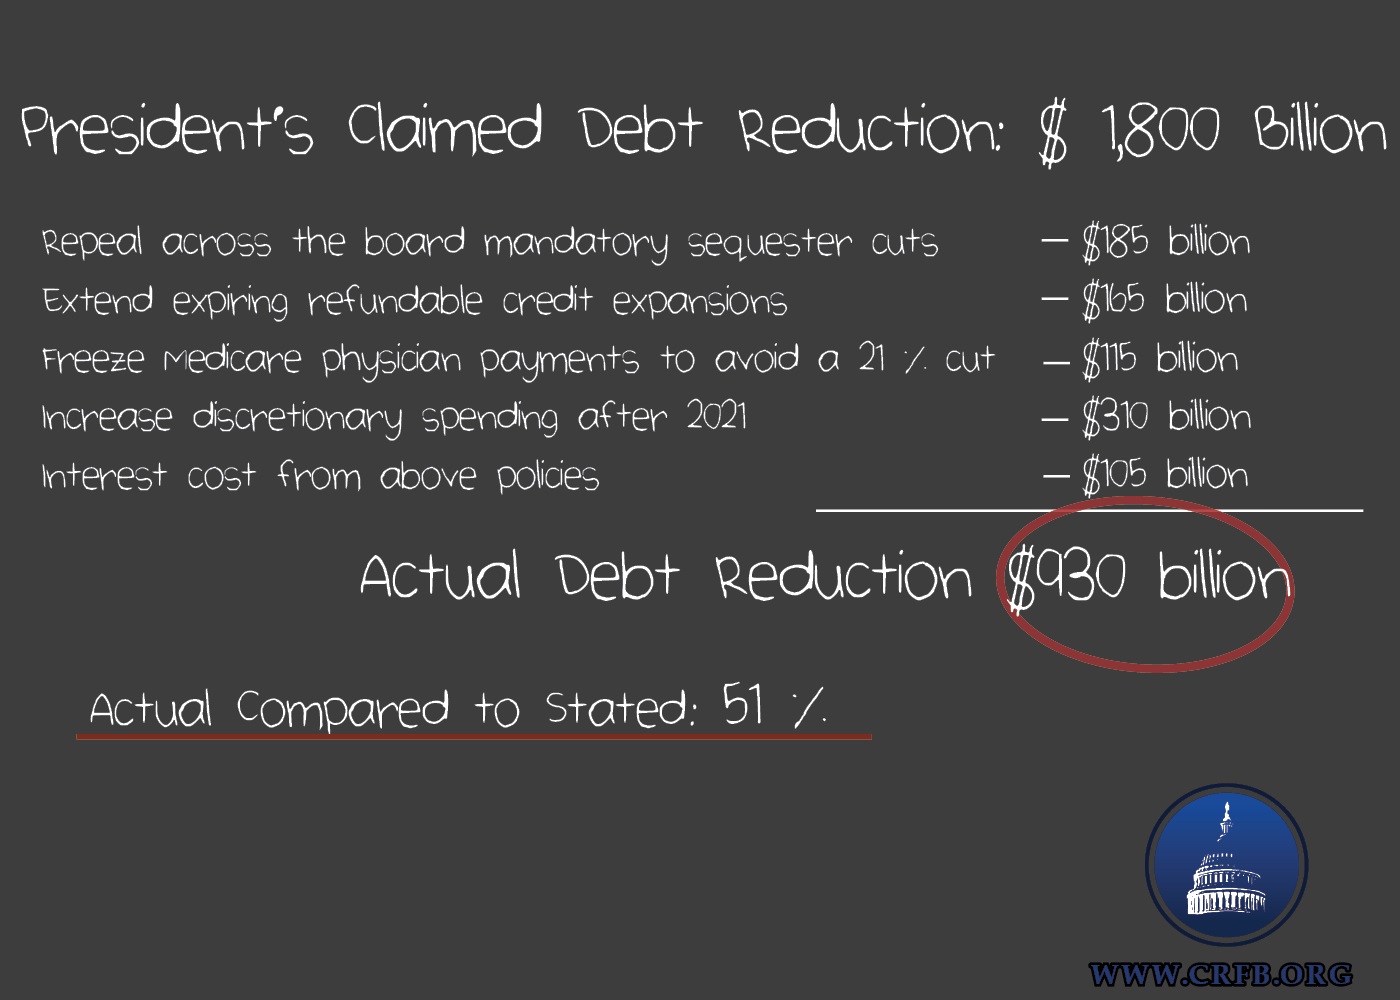
Chart 5: The Source of Costs and Savings in the President's Budget
In total, the President’s budget has about $2.5 trillion in new taxes and spending savings and $1.8 trillion in givebacks under our PAYGO baseline. The bulk of savings in the President's budget comes from $1.8 trillion in new revenue and roughly $500 billion in health care savings. The budget spends those savings roughly evenly split between three categories – sequester repeal, tax cuts, and other spending reductions – as well as some new health care spending.

Chart 6: Discretionary Spending in the President's Budget
The President's budget would increase discretionary spending by $74 billion in FY2016 – lifting non-defense discretionary spending $37 billion to pre-sequester levels and lifting defense discretionary spending by roughly the same amount. Beyond 2016, discretionary spending would continue to grow, but more slowly than inflation. As a result, 65 percent of the defense sequester and 45 percent of the non-defense discretionary sequester would still exist at the end of the sequester in 2021. Beyond 2021, discretionary spending grows by about 2 percent per year, which is well above CBO’s discretionary baseline but below the pre-sequester levels assumed by OMB.
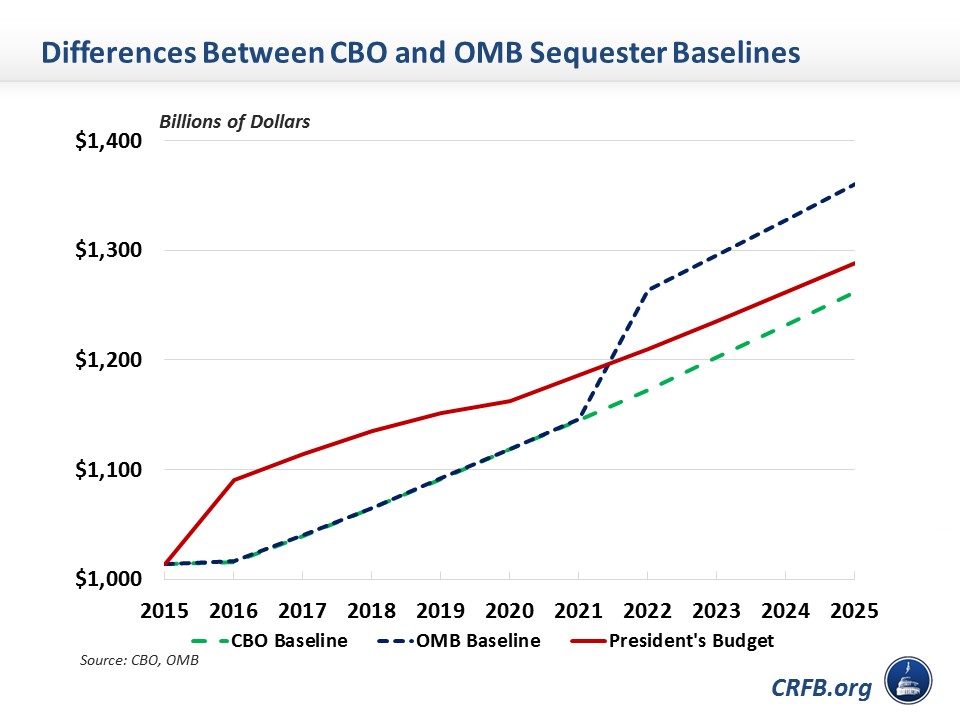
Chart 7: The Paths of Spending Categories Under the President's Budget
Despite increasing discretionary spending and reducing Medicare costs, the President's budget does not reverse current trends in budget composition. Under the President's budget, health and retirement spending will continue to rise as a share of GDP – from 9.8 percent of GDP in 2015 to 11.1 percent by 2025, while discretionary spending will continue to fall – from 6.4 percent of GDP in 2015 to 4.5 percent by 2025. These trends and the increasing size of interest payments continue outside the budget window.
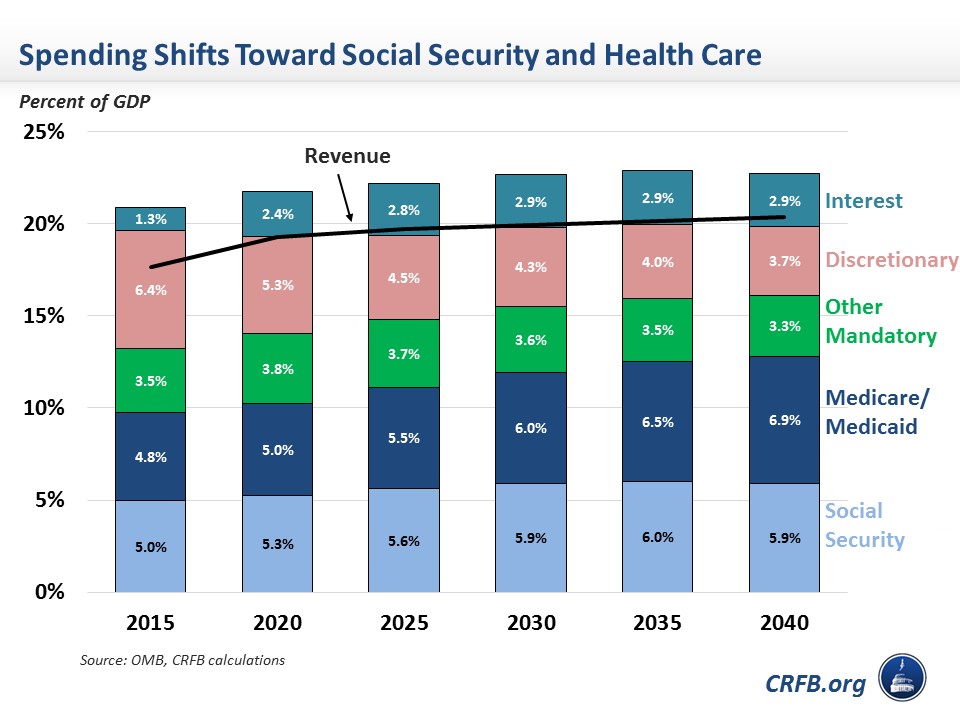
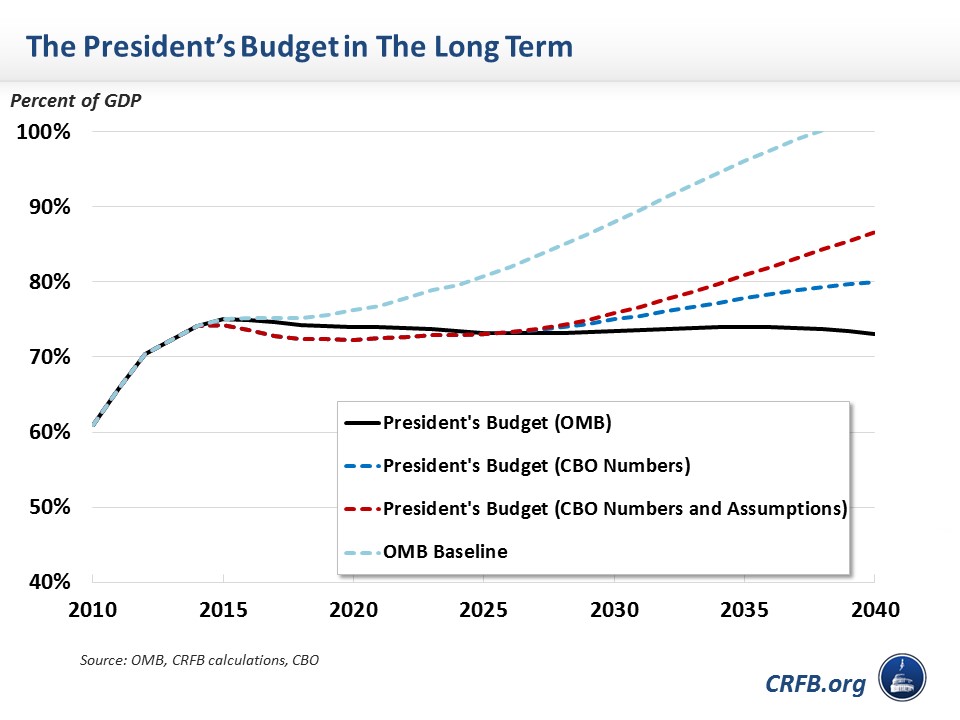
Chart 8: The Long Term Debt Path of the President's Budget
The President's budget, according to its own estimation, puts debt on a slow downward path that does not even get below 70 percent of GDP before 2025. To achieve fiscal sustainability and ensure the necessary amount of flexibility, debt should be on a clear downward path relative to GDP. In our blog on the long-term debt path in the President's budget, we look closely at OMB's projections. While OMB shows a stable and slightly downward path for the national debt, our rough estimates using CBO numbers and assumptions show the debt still on an unsustainable upward path. To assist in establishing a clear downward path for the debt, policymakers should pursue further health reforms beyond those in the President’s budget, as well as comprehensive Social Security reform to make that program solvent for 75 years and beyond.
For more analysis of the President's FY 2016 budget, be sure to read our full paper or look at our other blogs on the budget.


