Trump and Biden: The National Debt
The national debt is on course to reach a record share of the economy under the next presidential administration, due in part to policies approved by Presidents Trump and Biden during their time in office, including executive actions and legislation passed by Congress.
While it is important to understand the fiscal impact of the promises candidates make on the campaign trail – particularly because they reflect the candidates’ own policy preferences and are not impacted by unexpected external events or the actions of Congress – the fact that both leading candidates have served as President also allows for a comparison of their actual fiscal records. This analysis focuses on the estimated ten-year debt impact of policies approved by Presidents Trump and Biden around the time of enactment.1 In this analysis, we find:
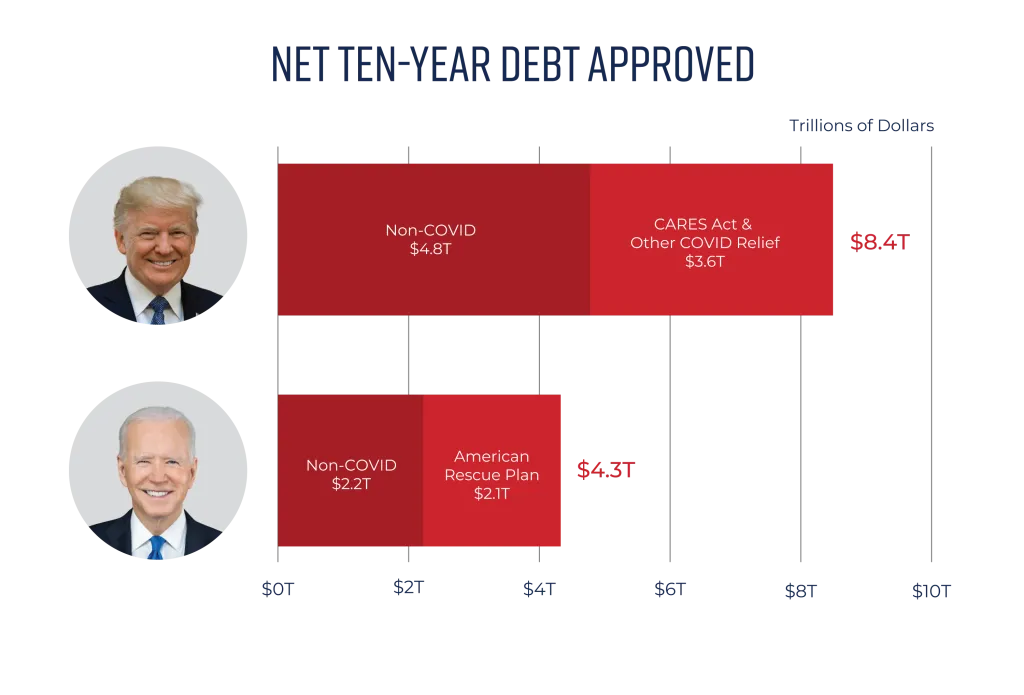
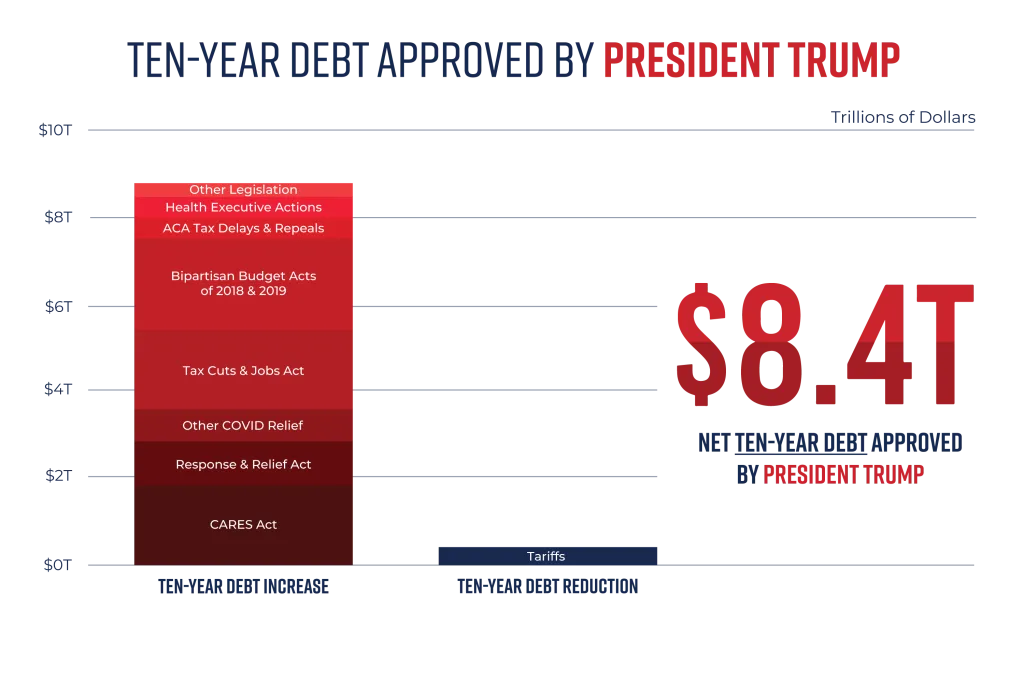
- President Trump approved $8.4 trillion of new ten-year borrowing during his full term in office, or $4.8 trillion excluding the CARES Act and other COVID relief.
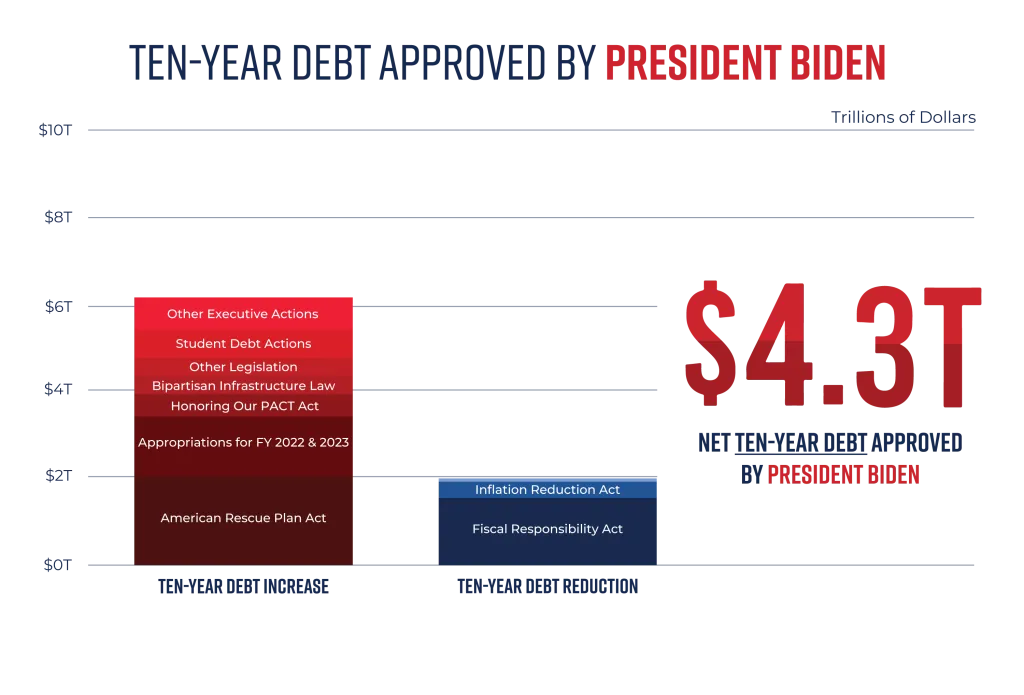
- President Biden, in his first three years and five months in office, approved $4.3 trillion of new ten-year borrowing, or $2.2 trillion excluding the American Rescue Plan.
- President Trump approved $8.8 trillion of gross new borrowing and $443 billion of deficit reduction during his full presidential term.
- President Biden has so far approved $6.2 trillion of gross new borrowing and $1.9 trillion of deficit reduction.
| US Budget Watch 2024 is a project of the nonpartisan Committee for a Responsible Federal Budget designed to educate the public on the fiscal impact of presidential candidates’ proposals and platforms. Throughout the election, we will issue policy explainers, fact checks, budget scores, and other analyses. We do not support or oppose any candidate for public office. |
In companion analyses, we will show:
- Roughly 77 percent of President Trump’s approved ten-year debt came from bipartisan legislation, and 29 percent of the net ten-year debt President Biden has approved thus far came from bipartisan legislation. The rest was from partisan actions.
- President Trump approved $2.2 trillion of debt in his first two years in office and $6.2 trillion ($2.6 trillion non-COVID) in his second two years. President Biden approved $4.9 trillion ($2.9 trillion non-COVID) in his first two years in office and has so far approved over $600 billion of net ten-year deficit reduction since.
- President Trump approved $5.9 trillion of net spending increases including interest ($2.8 trillion non-COVID) and $2.5 trillion of net tax cuts ($2.0 trillion non-COVID). President Biden has approved $4.3 trillion of net spending increases including interest ($2.3 trillion non-COVID) and roughly $0 of net tax changes ($60 billion revenue increase non-COVID).
- Debt held by the public rose by $7.2 trillion during President Trump’s term including $5.9 trillion in the first three years and five months. Debt held by the public has grown by $6.0 trillion during President Biden’s term so far.
- President Trump’s executive actions added less than $20 billion to ten-year debt on net. President Biden’s executive actions have added $1.2 trillion to ten-year debt so far.
- The President’s budget was on average 39 days late under President Trump and 58 days late under President Biden.
Summary Table: Executive Actions & Legislation Approved by Presidents Trump & Biden
| Policy | Ten-Year Debt Impact | Partisan/Bipartisan |
|---|---|---|
| President Trump (January 20, 2017-January 20, 2021) | ||
| Tax Cuts & Jobs Act | +$1.9 trillion | Partisan |
| Bipartisan Budget Acts of 2018 & 2019 | +$2.1 trillion | Bipartisan |
| ACA Tax Delays & Repeals | +$539 billion | Bipartisan |
| Health Executive Actions | +$456 billion | Partisan (Executive Action) |
| Other Legislation | +$310 billion | Bipartisan |
| New & Increased Tariffs | -$443 billion | Partisan (Executive Action) |
| CARES Act | +$1.9 trillion | Bipartisan |
| Response & Relief Act | +$983 billion | Bipartisan |
| Other COVID Relief | +$756 billion | Bipartisan* |
| Total, Debt Impact Under President Trump | +$8.4 trillion | Partisan: +$1.9 trillion Bipartisan: +$6.5 trillion |
| President Biden (January 20, 2021-June 21, 2024) | ||
| Appropriations for FY 2022 & 2023 | +$1.4 trillion | Bipartisan |
| Honoring Our PACT Act | +$520 billion | Bipartisan |
| Bipartisan Infrastructure Law | +$439 billion | Bipartisan |
| Other Legislation | +$422 billion | Bipartisan |
| Student Debt Actions | +$620 billion | Partisan (Executive Action) |
| Other Executive Actions | +$548 billion | Partisan (Executive Action) |
| Fiscal Responsibility Act | -$1.5 trillion | Bipartisan |
| Inflation Reduction Act | -$252 billion | Partisan |
| Deficit-Reducing Executive Actions | -$129 billion | Partisan (Executive Action) |
| American Rescue Plan Act | +$2.1 trillion | Partisan |
| Total, Debt Impact Under President Biden | +$4.3 trillion | Partisan: +$3.0 trillion Bipartisan: +$1.3 trillion |
Note: bipartisan indicates legislation passed with votes from both political parties in either chamber of Congress. *Includes $23 billion of executive actions in the form of student debt payment pauses.
How Much Debt Did President Trump Approve?
During his four-year term in office, President Trump approved $8.4 trillion of new ten-year borrowing above prior law, or $4.8 trillion when excluding the bipartisan COVID relief bills and COVID-related executive actions. Looking at all legislation and executive actions with meaningful fiscal impact, the full amount of approved ten-year borrowing includes $8.8 trillion of deficit-increasing laws and actions offset by $443 billion of deficit-reducing actions.2
These estimates are based on scores of legislation and executive actions rather than retrospective estimates. Scores are generally made on a conventional basis, though the Tax Cuts and Jobs Act (TCJA) is scored dynamically. The actual debt impact of the policies was likely somewhat higher than these scores. In particular, the TCJA likely reduced revenue more than projected and saved less from repealing the individual health care mandate penalty,3 while the Employee Retention Credit was likely far more expensive than originally estimated.
Sources: CRFB estimates based on CBO and OMB projections.
The major actions approved by President Trump (and ten-year impact with interest) include:
- The Tax Cuts and Jobs Act of 2017 ($1.9 trillion debt increase)
- The Bipartisan Budget Acts of 2018 and 2019 ($2.1 trillion debt increase)
- ACA Tax Delays and Repeals ($539 billion debt increase)
- Health Executive Actions ($456 billion debt increase)
- Other Legislation ($310 billion debt increase)
- New and Increased Tariffs ($443 billion debt reduction)
- The CARES Act ($1.9 trillion debt increase)
- The Response & Relief Act ($983 billion debt increase)
- Other COVID Relief ($756 billion debt increase)
How Much Debt Has President Biden Approved?
Over his first three years and five months in office, President Biden has approved $4.3 trillion of new ten-year borrowing, or $2.2 trillion when excluding the American Rescue Plan Act. This includes $6.2 trillion of deficit-increasing legislation and actions, offset by $1.9 trillion of legislation and actions scored as reducing the deficit.
These estimates are based on scores of legislation and executive actions rather than retrospective estimates and do not include preliminary rules, unexecuted “side deals,” or actions ruled illegal by the Supreme Court. Updated scores and in-process actions would increase the total. For example, an updated estimate would likely wipe away the $252 billion of scored savings from the Inflation Reduction Act,4 the informal FRA side deals would reduce its savings by about $500 billion, and the new student debt cancellation plan could cost $250 to $750 billion.
Sources: CRFB estimates based on CBO and OMB projections.
The major actions approved by President Biden so far (and ten-year impact with interest) include:
- Appropriations for FY 2022 and 2023 ($1.4 trillion debt increase)
- The Honoring Our PACT Act ($520 billion debt increase)
- The Bipartisan Infrastructure Law ($439 billion debt increase)
- Other Legislation ($422 billion debt increase)
- Student Debt Actions ($620 billion debt increase)
- Other Executive Actions ($548 billion debt increase)
- The Fiscal Responsibility Act ($1.5 trillion debt reduction)
- The Inflation Reduction Act ($252 billion debt reduction)
- Deficit-Reducing Executive Actions ($129 billion debt reduction)
- The American Rescue Plan Act ($2.1 trillion debt increase)
Conclusion
The next presidential term will present significant fiscal challenges. While past performance is not necessarily indicative of future actions, it is helpful to examine the fiscal performance from each President’s time in office for clues as to how they plan to confront these challenges or how high of a priority fiscal responsibility will be on their agendas.
Both candidates approved substantial amounts of new borrowing in their first term. President Trump approved $8.4 trillion in borrowing over a decade, while President Biden has approved $4.3 trillion so far in his first three years and five months in office. Of course, accountability also rests with Congress as a co-equal branch of government, which passed legislation constituting the majority of the fiscal impact under both presidents.
Some of this borrowing was clearly justified, particularly in the early parts of the COVID-19 pandemic when joblessness was rising rapidly and large parts of the economy were effectively shut down. However, funding classified as COVID relief explains less than half of the borrowing authorized by either President, and arguably, a meaningful portion of this COVID relief was either extraneous, excessive, poorly targeted, or otherwise unnecessary.5
In supplemental analyses, we will compare a number of other aspects of the candidates’ fiscal records.
During the next presidential term, the national debt is projected to reach a record share of the economy, interest costs are slated to surge, the debt limit will re-emerge, discretionary spending caps and major tax cuts are scheduled to expire, and major trust funds will be hurtling toward insolvency.
Adding trillions more to the national debt will only worsen these challenges, just as both Presidents Trump and Biden did during their terms along with lawmakers in Congress. The country would be better served if the candidates put forward and stuck to plans to reduce the national debt, secure the trust funds, and put the budget on a sustainable long-term path.
Appendix I: Details of Policies Approved by President Trump
- Tax Cuts and Jobs Act of 2017 ($1.9 trillion debt increase) – The TCJA included several tax cuts and reforms. Among those changes, the law reduced individual and corporate income tax rates, virtually eliminated the alternative minimum taxes, repealed or limited numerous deductions and tax breaks, replaced personal and dependent exemptions with an expanded standard deduction and Child Tax Credit, established a new deduction for pass-through business income, shrunk the estate tax, offered full expensing of equipment purchases, and reformed the tax treatment of international income. Most individual and estate tax changes were temporary while most corporate changes were permanent. The legislation also repealed the Affordable Care Act’s individual mandate penalty. As a result of these policy changes, the Congressional Budget Office (CBO) projected the TCJA would boost output by roughly 1 percent at peak and 0.6 percent after a decade. The estimate incorporated in this analysis includes the dynamic feedback effects of this faster growth, based on CBO’s April 2018 analysis of the bill. While it is impossible to know exactly how the bill’s fiscal impact compared to this prospective estimate, a number of factors point towards it adding significantly more to the debt, including: higher-than-expected inflation and nominal incomes and profits leading to higher revenue loss; SALT cap workarounds; increased use of bonus depreciation; and lower than expected revenue from limiting the use of pass-through losses. As a reference point, CBO’s latest estimate for extending the expiring elements of the TCJA is almost 50 percent higher than its 2018 estimate. In addition, the budgetary savings from the individual mandate penalty repeal were likely less than originally projected.
- The Bipartisan Budget Acts of 2018 and 2019 ($2.1 trillion debt increase) – The Bipartisan Budget Acts (BBA) of 2018 and 2019 increased the caps on defense and nondefense discretionary spending set by the 2011 Budget Control Act (BCA) and further reduced through a ‘sequester’ activated after the failure of the Joint Select Committee on Deficit Reduction. BBA 2018 increased the caps in FY 2018 and 2019 by a combined $296 billion, effectively repealing the $91 billion per year sequester and further increasing spending above the BCA caps. BBA 2019 essentially codified these increases by boosting the FY 2020 and 2021 caps by a combined $320 billion. Because the 2021 cap was the final year of the BCA caps, BBA 2019 increased baseline discretionary spending levels beyond 2021 to the new 2021 level plus inflation. Both bills also included smaller additional policies, including some partial offsets. In total, BBA 2018 added $418 billion to the ten-year debt and BBA 2019 added $1.7 trillion.
- ACA Tax Delays and Repeals ($539 billion debt increase) – Three taxes enacted by the 2010 Affordable Care Act (ACA) – the health insurer tax, the “Cadillac tax” on high-cost health insurance, and the medical device excise tax – were delayed in a 2018 continuing resolution. They were subsequently repealed in one of the full-year funding bills for FY 2020. The Joint Committee on Taxation (JCT) estimated that the health insurer tax would have raised about $150 billion over a decade, the Cadillac tax would have raised $200 billion, and the medical device excise tax would have raised $25 billion. In addition to these tax repeals, policymakers enacted roughly $70 billion of other unpaid-for policies related to health care, retirement savings, and other priorities in these two bills. Interest costs added $64 billion more.
- Health Executive Actions ($456 billion debt increase) – President Trump approved two health-related executive actions with significant costs over his term. Ending federal appropriations for the ACA’s cost-sharing reduction payments in 2017 led insurers to raise premiums on “silver” ACA plans to fund low-income cost sharing subsidies, ultimately increasing the cost of federal subsidies by an estimated $220 billion. Meanwhile, a 2020 rule to restrict prescription drug rebates paid to pharmacy benefit managers and insurer plans was estimated to cost $177 billion. Interest costs added $59 billion more. Importantly, the rebate rule was delayed and ultimately repealed by Congress under President Biden.
- Other Legislation ($310 billion debt increase) – President Trump signed a number of other deficit-increasing bills into law over the course of his term. This includes several appropriations bills for disaster relief as well as the changes to mandatory programs (CHIMPs) that boosted spending in the full-year appropriations bills enacted in his term. Additionally, President Trump signed a permanent extension of several tax “extenders,” which are tax policies that have been routinely extended for short periods. Finally, he signed the Great American Outdoors Act, which transferred certain offsetting receipts and authorized them to be spent without appropriation, and the permanent authorization of the 9/11 victims fund, which authorized funds to pay out claims to 9/11 victims.
- Tariffs ($443 billion debt reduction) – Over the course of his presidency, President Trump used his authority under the Trade Act of 1974 and the International Emergency Economic Powers Act of 1978 to increase a number of import tariffs through executive action. Beginning in 2018, the Trump Administration announced the imposition or increase to a variety of tariffs, including on washing machines, solar panels, and steel and aluminum products. In 2019, the tariff rate on many Chinese imports was increased from 10 percent to 25 percent. Based on CBO’s estimates at the time, we estimate these tariffs will have generated over $440 billion of revenue and interest savings over a decade.
- The CARES Act ($1.9 trillion debt increase) – Enacted in the wake of the COVID-19 pandemic in March 2020, the bipartisan CARES Act included expanded and extended unemployment benefits, economic relief checks of $1,200 per eligible adult and $500 per child, the Paycheck Protection Program (PPP) to provide support to small businesses to keep employees on payroll, and emergency disaster loans and grants to businesses, industries, health care facilities, educational institutions, state and local governments, and others, among many other provisions. Based on our ongoing tracking, the actual fiscal impact of the CARES Act was likely similar to the initial score though perhaps slightly higher overall.
- The Response & Relief Act ($983 billion debt increase) – Enacted in December 2020 as part of the omnibus appropriations bill for Fiscal Year (FY) 2021, the Response & Relief Act included funding for a second tranche of PPP payments and small business grants, an extension of enhanced unemployment benefits, economic relief checks of $600 per eligible person, funding support for schools and higher education institutions, vaccine and testing funding, targeted support to industries greatly impacted by COVID-19, an extension and expansion of the Employee Retention Credit, and an extension of various other COVID-related tax and spending relief programs. Based on our ongoing tracking, the actual fiscal impact of the Response & Relief Act was likely higher than the initial score due to the significantly higher-than-expected deficit increase from the Employee Retention Credit.
- Other COVID Relief ($756 billion debt increase) – President Trump approved several other measures related to the COVID-19 pandemic and recession. This includes the three other COVID relief laws enacted in March and April 2020: the Coronavirus Preparedness and Response Supplemental Appropriations Act, the Families First Coronavirus Response Act, and the Paycheck Protection Program and Health Care Enhancement Act. It also includes the student loan repayment pauses enacted at the onset of COVID and extended after the CARES Act’s pause ended in October 2020. President Trump also approved other executive actions that resulted in little deficit impact. Based on our ongoing tracking, the actual fiscal impact of these bills were likely much higher than the initial score due to the significantly higher-than-expected revenue loss from the Employee Retention Credit and the higher Medicaid and SNAP costs resulting from a longer-than-projected public health emergency.
Appendix II: Details of Policies Approved by President Biden So Far
- Appropriations for FY 2022 and 2023 ($1.4 trillion debt increase) –President Biden signed full-year omnibus appropriations bills for FY 2022 and 2023, boosting nominal appropriations by 6 percent and then 9 percent. While those bills only set funding for those specific years, future-year projected levels are calculated by assuming continued inflation growth. This is consistent with the reality that appropriators generally work from the prior year’s spending levels. Based on CBO, we estimate the FY 2022 omnibus directly increased spending by $50 billion and indirectly by $519 billion above baseline, while the FY 2023 omnibus increased spending directly by $58 billion and base discretionary spending indirectly by $511 billion. Interest costs added $175 billion more. Both laws’ impacts on baseline deficits would be substantially smaller had they been scored against an updated CBO baseline that reflected actual inflation rather than projections – the bulk of the increases under both laws kept spending apace with the very-high rate of inflation for those years.
- The Honoring Our PACT Act ($520 billion debt increase) – Enacted in August 2022, the PACT Act created new benefits for veterans exposed to toxic substances during their tours of duty, expanded existing health and disability benefits, and modified eligibility tests that allowed more veterans to automatically qualify for benefits. Although veterans’ health spending is generally discretionary, the PACT Act allowed the cost of the expansion to be classified as mandatory spending and allowed lawmakers to shift existing discretionary costs to the mandatory side of the budget. Based on CBO’s score, the PACT Act increased spending by between $277 billion and $667 billion, depending on how much funding was reclassified. Our estimate reflects the midpoint (plus interest), which policymakers effectively codified in the Fiscal Responsibility Act of 2023.
- The Bipartisan Infrastructure Law ($439 billion debt increase) – The 2021 Infrastructure Investment and Jobs Act authorized more than $500 billion of direct spending and tax breaks related to surface transportation, broadband, energy and water, transit, and other infrastructure. The law also increased baseline levels of highway spending, translating to more than $50 billion in indirect costs. While lawmakers claimed that it was fully paid for at the time of passage, CBO determined that it only contained $173 billion of scorable savings, leading to $439 billion of new borrowing when interest is included.
- Other Legislation ($422 billion debt increase) – President Biden signed several other bipartisan pieces of legislation during his first term. This includes several packages of aid to Ukraine, Israel, and Gaza, additional emergency spending related to disaster relief and military readiness, $80 billion of investments and tax credits to encourage onshoring manufacturing facilities for semiconductors in the CHIPS and Science Act, and additional FY 2024 appropriations spending based on “side deals” to the Fiscal Responsibility Act.
- Student Debt Actions ($620 billion debt increase) – The Biden Administration has instituted several changes to the federal student loan program through executive actions. Most significantly, the Education Department introduced the Savings on a Valuable Education (SAVE) income-driven repayment (IDR) program, which reduced required payments and interest accrual for those enrolled, among other changes – estimated to cost $276 billion. In addition, President Biden extended the pause of student debt repayments and cancellation of interest for 31 months at a cost of $146 billion. And finally, President Biden enacted a number of targeted debt cancellation measures, including expansions of the Public Service Loan Forgiveness program and cancellation of debt borrowed for institutions that closed or were found to be fraudulent, at a cost of $145 billion. President Biden also enacted a policy to cancel up to $20,000 per borrower of student debt that would have cost an additional $330 billion (after interactions with the SAVE plan), but this was ruled illegal by the Supreme Court. Recently, the Administration introduced an alternative debt cancellation plan that could cost between $250 and $750 billion, though it has yet to be implemented and is not counted here because our estimates only include regulations that have been finalized through the full rulemaking process.
- Other Executive Actions ($548 billion debt increase) – President Biden has also expanded deficits through other executive actions. Most significantly, he approved over $200 billion of borrowing by changing the way Supplemental Nutrition Assistance Program (SNAP) benefits – also known as food stamps – are calculated and adjusted. More recently, the Administration announced a rule to limit vehicle emissions, which we estimate will add nearly $170 billion to the debt by boosting the cost of electric vehicle tax credits expanded under the IRA and reducing gas tax revenue. Other executive actions will add a combined $180 billion to the debt by expanding Medicaid enrollment, changing the way prescription drug price concessions are considered by Medicare plans, addressing the ACA’s “family glitch,” allowing states to boost Medicaid payments to managed care plans to pull in additional federal dollars, and an expansion of allowed income for Supplemental Security Income recipient households.
- Fiscal Responsibility Act ($1.5 trillion debt reduction) – In June 2023, President Biden signed the bipartisan Fiscal Responsibility Act (FRA), which capped discretionary spending for FY 2024 and 2025, among other changes. The FRA set 2024 nondefense discretionary levels to 5 percent below the 2023 level, set defense to be 3 percent higher, and set both to grow by 1 percent between 2024 and 2025. These caps, along with other measures, were scored to generate over $250 billion of direct savings and also reduce the baseline for future spending to generate an additional $1.1 trillion of additional savings. With interest, the FRA was estimated to reduce deficits by $1.5 trillion over a decade. Importantly, negotiators at the time agreed to a number of “side deals” mentioned above that would reduce the FRA’s savings to roughly $1 trillion if enacted in full in future appropriations bills. A different but similar set of side deals were enacted for FY 2024 and added about $85 billion to deficits – these are included in the “other legislation” category. Additional side deals will not be counted until enacted.
- Inflation Reduction Act ($252 billion debt reduction) – In August 2022, President Biden signed the Inflation Reduction Act (IRA) into law, a reconciliation bill focused on energy, health care, and tax changes. The IRA established new and increased existing energy- and climate-related spending and tax credits, expanded ACA health insurance subsidies, required prescription drug negotiations and other drug pricing reforms, introduced a 15 percent corporate “book minimum tax,” established an excise tax on stock buybacks, increased funding to the IRS to close the tax gap, and made other changes. At the time of passage, CBO and JCT estimated the IRA’s tax breaks and spending would reduce revenue and increase spending by about $500 billion, while its offsets would generate almost $740 billion. Recent estimates of the impact of repealing the IRA tax credits suggest these provisions will reduce revenue and increase spending by $260 billion higher than the official score; at the same time, the IRA’s offsets are also likely to raise more in revenue. On net, we expect a full re-estimate of the IRA would score as roughly budget neutral through 2031, excluding effects related to subsequent regulatory changes. This analysis attributes the additional cost of these regulations as executive actions.
- Deficit-Reducing Executive Actions ($129 billion debt reduction) –President Biden approved two other executive actions that would result in savings over a decade, including changes to payments for Medicare Advantage plans and a temporary stay of the subsequently repealed Trump prescription drug rebate rule.
- American Rescue Plan Act ($2.1 trillion debt increase) – Enacted in the Spring of 2021, the American Rescue Plan Act was the final piece of legislation that contained many major components designed to provide COVID relief. It included several extensions of enhanced unemployment benefits, additional relief checks of $1,400 per person, and a slew of funding for state and local governments, educational institutions, health care providers, public health agencies, and others. The legislation also included about $300 billion of policies that we have described as extraneous to the COVID crisis – including a pension bailout and expansions of the Child Tax Credit, Earned Income Tax Credit, health insurance subsidies, and child care tax credit – and roughly $100 billion of offsets.
Appendix III: Methodology
This analysis estimates the additional borrowing approved by Presidents Trump and Biden through tax and spending changes passed by Congress or contained in executive actions from their administrations. It does not estimate the amount of debt that accumulated over their terms, which partially reflects actions taken prior to their time in office and does not account for the fiscal impact of the actions approved by the President but incurred outside of his four-year term. We will publish changes in debt during their terms in a supplemental analysis.
Our analysis incorporates all major pieces of legislation and executive actions – those with more than $10 billion of ten-year budget impact – approved by Presidents Trump and Biden. Estimates rely on ten-year budget scores, as under standard convention. In order to rely on official scores wherever possible, however, all estimates are based on the ten-year budget window at the time of enactment – meaning different policies cover different time frames and thus are not purely additive or comparable.
In general, estimates rely on official estimates from the Congressional Budget Office (CBO) and Joint Committee on Taxation (JCT) presented prospectively. When such scores are not available or not comprehensive, we may use estimates from the Office of Management and Budget, the regulatory agencies, or our own estimates.
Estimates are not updated to incorporate data and results made available well after implementation; no legislation signed by either President Trump or President Biden has been re-estimated in full to incorporate observed costs or effects, and partial updates would bias the overall numbers. However, possible differences between initial scores and actual costs, including from the TCJA, the IRA, and COVID relief, are discussed throughout this paper.
Estimates incorporate impact on interest costs, which we calculate using the most recent CBO debt service tool at the time of enactment, unless interest impact is included in the estimate. Estimates are generally based on conventional scoring, but in the case of the Tax Cuts and Jobs Act, we incorporate macroeconomic impacts as estimated by CBO shortly after enactment.
All estimates are in nominal dollars at the time of approval, which means deficit impact from earlier budget windows generally represent a larger share of GDP per dollar due to higher price levels and output over time.
Finally, the estimates are based on the policies as written and do not try to correct for arbitrary cliffs, side agreements, or other budget gimmicks that may create a misleading picture of the intended fiscal impact of the policy.
1 Our estimates compare ten-year estimates of each action before implementation, generally using prospective scores of policies and adding them together despite being over different windows. Although this is not a perfect apples-to-apples comparison for a variety of reasons, it allows us to rely on official numbers and continue to compare over time. See the methodology section for a more detailed explanation.
2 Many pieces of legislation with fiscal impact include tax and spending changes that both add to and reduce projected deficits. The $8.8 trillion figure is based on the net deficit impact of deficit-increasing bills, rather than the gross deficit increases within those bills. For example, the $1.9 trillion impact of the TCJA represents the combination of tax cuts, base broadening, lower spending as a result of repealing the individual mandate penalty, interest, and dynamic effects on revenue and spending.
3 The larger deficit impact from the TCJA is due to a combination of a larger nominal tax base, lower health savings from individual mandate repeal, the unexpected use of a SALT cap workaround, reduced revenue collection from the limit on pass-through losses, higher revenue loss related to bonus depreciation, and other factors.
4 Due to higher prices and output, greater demand for subsidized activities, and laxer-than-expected regulations, the IRA’s energy provisions are now expected to have a fiscal impact of $660 billion – about two-thirds more than the original estimate of roughly $400 billion. This excludes the effects of the Administration’s vehicle emissions rule, which we’ve scored separately. At the same time, revenue collection under the IRA is also likely to be higher in light of higher-than-projected nominal corporate profits, greater expected voluntary tax compliance, and less-than-expected responsiveness to the buyback tax. Overall, we believe a re-estimate of the IRA would be roughly budget neutral. The emissions rule approved by President Biden would increase deficits by about $170 billion – mainly by further increasing the fiscal impact of the IRA tax credits – and is included in our tally of his executive actions.
5 In a previous analysis, we estimated that $500 to 650 billion of COVID relief was extraneous – unrelated to the pandemic or subsequent economic fallout – including $300 to $335 billion enacted under President Trump and $200 to $315 billion under President Biden. These prior estimates are not perfectly comparable to estimates in this paper but give a sense of scale. In additional analyses, we estimated that the American Rescue plan likely significantly overshot the output gap it was aiming to close while providing excessive relief to a number of sectors. There were also excesses and lack of targeting in earlier COVID relief packages, including as it related to stimulus checks, the additional $600 of weekly unemployment benefits, and the Paycheck Protection Program.
What's Next
-
Image

-

-