What If...
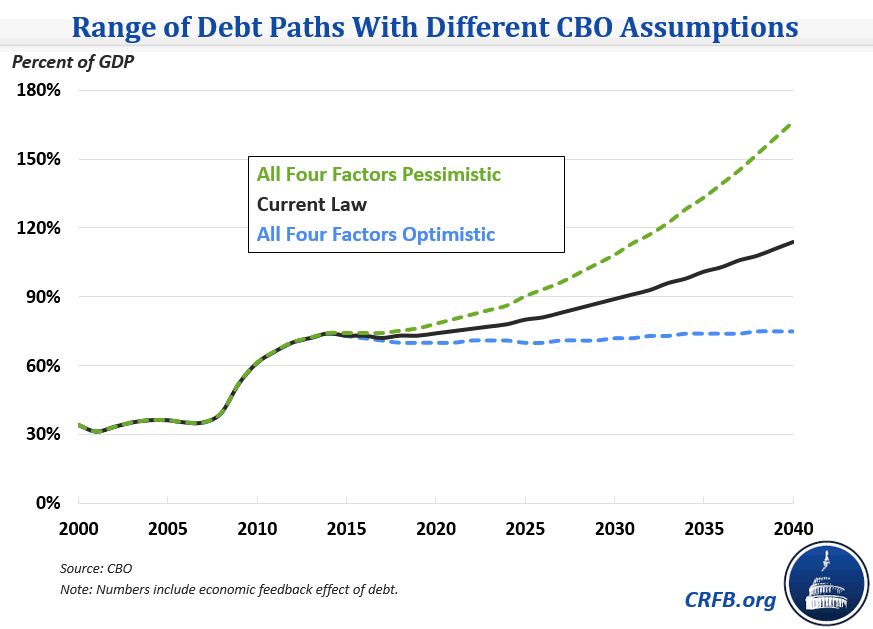
Any budget projection is inherently uncertain, and that uncertainty is magnified when the projection period is extended to 25 or 75 years, as the Congressional Budget Office (CBO) does in its long-term outlook. That's why CBO publishes an Alternative Fiscal Scenario (AFS), to illustrate what would happen to debt if lawmakers cut taxes and increase spending differently than projected by current law (the Appendix of our analysis explains the differences). However, policy is not the only source of uncertainty in long-term projections; the economic and technical assumptions used also greatly affect CBO's estimates. Fortunately, CBO provides a band of assumptions for mortality, productivity, interest rates, and health care cost growth, showing how they would each affect debt in 2039 (at 111 percent of GDP in the Extended Baseline, including economic feedback effects). We delve into these details below.
Mortality
CBO's projections assume that population-wide mortality rates decline at 1.2 percent per year. This is somewhat higher than the 0.8 percent decline that the Social Security Trustees assume and is a main reason why CBO's Social Security projections look worse than the Trustees'. CBO evaluates what would happen to debt through 2039 if mortality rates declined 0.5 percentage points faster or slower annually. These different declines result in life expectancy for a 65 year-old being about one year longer or shorter than the default by 2039.
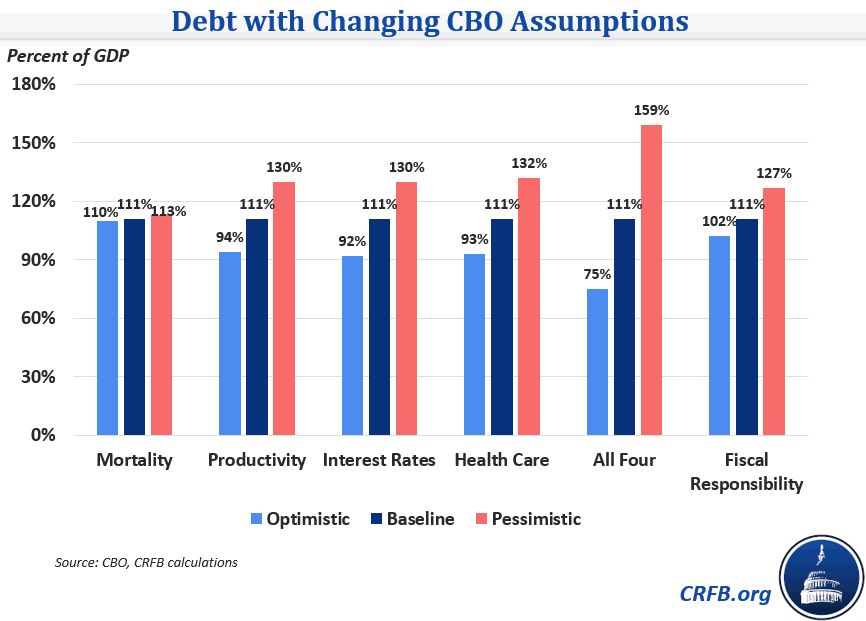
Different life expectancy and mortality rate assumptions affect spending on Social Security, Medicare, and Medicaid (and certain other mandatory programs), but they also can affect revenue by changing the labor supply; CBO assumes that every additional year of life expectancy would cause a worker to spend three more months in the labor force. However, these alternative assumptions make little difference for debt through 2039: it rises from 111 percent of GDP to 113 percent with the faster decline in mortality and goes to 110 percent with the slower decline. These differences would compound over time though, so greater separation would occur in later years.
Productivity
Since CBO projects that the economy will (just about) fully recover by 2018, potential GDP growth determines economic expansion in their projections. One of the determinants of this growth is total factor productivity, which has grown at an average annual rate of 1.4 percent since 1950. CBO assumes that its growth will average 1.3 percent over the long term.
The rate of productivity growth affects debt primarily through its impact on the denominator of the debt-to-GDP ratio and on the amount of revenue the government takes in. However, according to CBO, it would also raise interest costs because the government would have to compete with private capital that has higher rates of return.
CBO evaluates productivity growth that is either 0.5 percentage points higher or slower than the baseline. The higher productivity lowers debt from 111 percent of GDP in 2039 to 94 percent, while the lower productivity raises debt to 130 percent of GDP.
Interest Rates on Federal Debt
Interest rates are an important determinant of the amount needed to service the debt. The very low rates the federal government has paid in recent years has enabled it to spend little on interest as a share of GDP by recent historical standards, despite a large run-up in debt. Projecting these rates over 75 years can be very difficult, though, due to their volatility. Notably, the CBO lowered its projection of the average long-run interest rate on federal debt by 0.5 percentage points in this year's outlook to 4.7 percent.
Assuming that the interest rate on government debt was 0.75 percentage points lower (but other interest rates stayed the same), 2039 debt would be 92 percent of GDP in 2039 instead of 111 percent, and interest spending that year would be 3.6 percent of GDP instead of 4.7 percent. In the other direction, debt would rise to 130 percent, and the interest burden would be 7.5 percent.
Health Care Cost Growth
The assumption about future health care costs is arguably the most important that CBO makes and is very uncertain given the recent slowdown in spending growth. The rate of health care cost growth obviously affects health care spending programs, but also affects revenue by changing the share of worker compensation that goes to tax-exempt employer-provided health insurance.
In their analysis, CBO looks at different rates of per-beneficiary spending growth for Medicare and Medicaid, since those are the two largest open-ended health care programs. If their growth rates were lower by 0.75 percentage points annually, debt in 2039 would be 93 percent of GDP rather than 111 percent, while higher growth rates by the same amount would lead to higher debt at 132 percent of GDP.
Note that CBO also publishes numbers about health care spending if there is no excess health care cost growth (per-beneficiary spending grows with GDP), under which federal health care spending is about 45 percent lower than the baseline at the end of the 75-year window. By our estimate, if there was no excess health care cost growth, debt would grow to close to 100 percent of GDP by the 2040s, but it would decline after that.
All Four Factors
In addition to these individual analyses, CBO shows the path of debt if all four factors happen to turn out more optimistic or pessimistic than CBO's baseline projections, although each factor was only changed by half of what the individual analyses were. The most optimistic scenario would have debt remain stable near its current level, reaching 75 percent of GDP by 2039, while the most pessimistic scenario would have debt rising sharply to 159 percent by 2039. In other words, even if economic and technical assumptions all turn out better for the debt than expected and lawmakers adhere to PAYGO, debt still only stabilizes at twice its historical average. Moreover, efforts to reduce the debt can themselves help these scenarios to come true, increasing the likelihood of sustained lower interest rates, higher productivity growth, and slower health care cost growth.

CBO shows how widely its 25-year debt projections could vary if these four assumptions change, but there are many other dimensions of uncertainty in their economic and technical projections. The agency notes that economic depressions, disasters, wars, unforeseen financial obligations, or demographic shifts could also throw off projections.
Fiscal Responsibility
The scenarios above show how different economic assumptions can change CBO’s projections. But in all scenarios, CBO makes a fixed set of policy assumptions, essentially projecting that Congress and the President will continue to abide by current law. Unfortunately, as we’ve seen recently, Congress has a tendency to add to the deficit over time – including by extending expired/expiring tax cuts or spending increases, as well as enacting new ones.
To account for this, we created a fifth category for "fiscal responsibility." On the low end, our “PAYGO baseline” assumes lawmakers adhere to current law and wind down war spending as opposed to continuing to grow it with inflation. On the other hand, the "No Offset Baseline," assumes that in addition to this drawdown policymakers extend doc fixes, make permanent various expired and expiring tax provisions, and repeal the sequester. The PAYGO baseline shows a similar path to current law but with slightly lower debt at 102 percent of GDP in 2039, while the No Offset Baseline rises faster, reaching 127 percent of GDP. Importantly, this No Offset Baseline is not the most pessimistic scenario possible because it excludes a number of potentially fiscally irresponsible actions such as extending bonus depreciation and expanding veterans' health benefits.

While long-term projections are inherently very uncertain, uncertainty is not a reason to disregard them. It is reasonable to anticipate a significant rise in debt over the long term considering the demographic and health care pressures facing the budget. Even if lawmakers adhered to PAYGO and economic and technical assumptions turned out better than CBO anticipates in its baseline, debt would only stabilize at twice its historical share of GDP; it could very well could be worse.


