How the Trustees and CBO Differ on Social Security
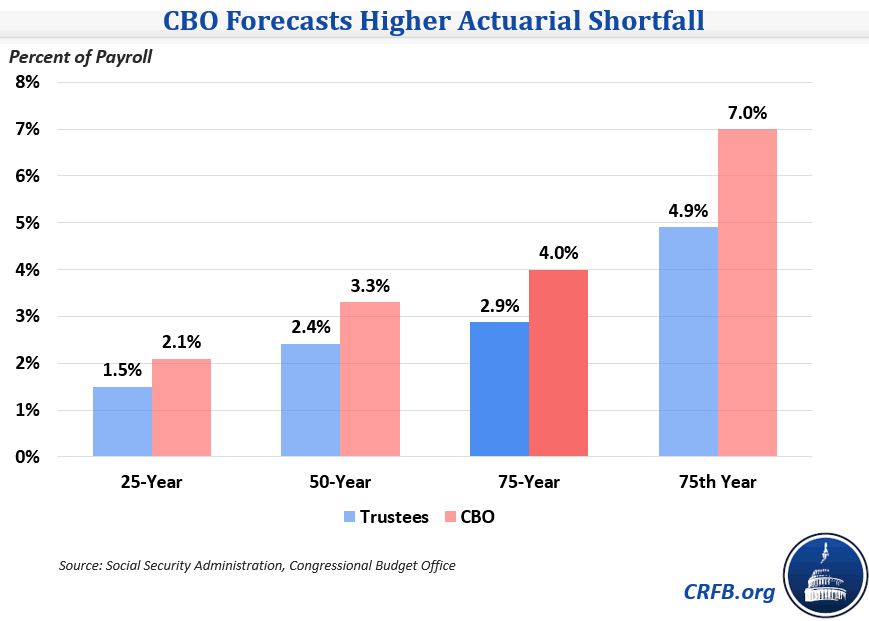
The release of the Social Security Trustees Report just two weeks after CBO released its long-term outlook gives us a good opportunity to compare how the two reports differ in their projections. Overall, CBO anticipates Social Security will be in greater financial trouble than the Trustees do, forecasting an exhaustion date for the combined trust fund three years earlier in 2030 and a 75-year actuarial shortfall that is more than one-third higher. But there is more going on here than meets the eye.
Specifically, CBO projects a 75-year actuarial shortfall of 4 percent of taxable payroll compared to the Trustees' figure of 2.9 percent; as a percent of GDP, these figures are 1.4 and 1 percent, respectively.

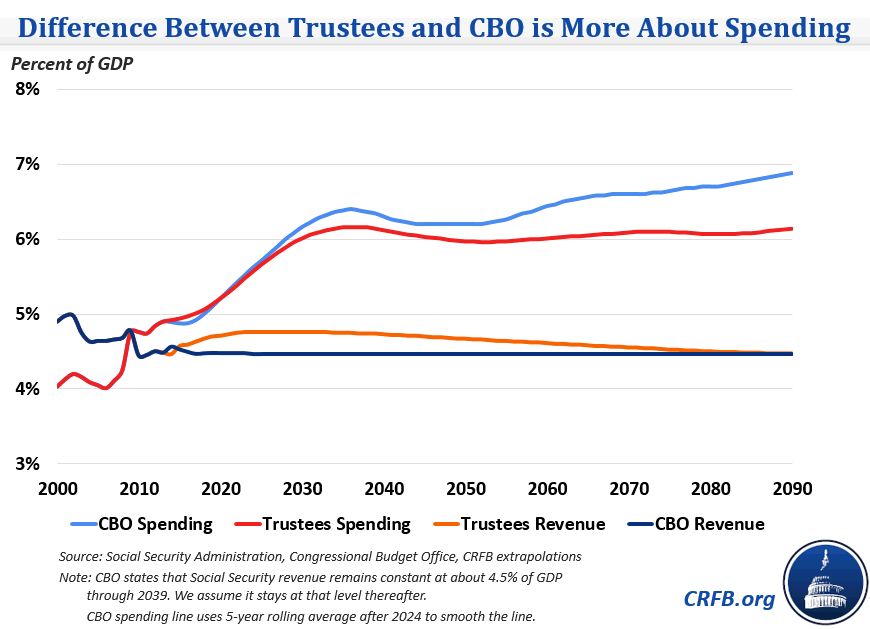
The difference between CBO and the Trustees can be explained mainly by looking at spending projections, particularly projections beyond 2050. Over the projection window, CBO estimates spending will total 18 percent of payroll (6.3 percent of GDP), while the Trustees estimate spending to total 16.8 percent of payroll (5.9 percent of GDP).
The difference is more pronounced late in the projection window. Both CBO and the Trustees project a huge increase in spending through to about 2035, from about 4 percent of GDP to well above 6 percent, as baby boomers retire and the birth rate remains low. As a share of GDP, both also project a small decline through 2050 that leaves spending closer to 6 percent of GDP. After 2050, however, the Trustees project only a slight increase in spending as a share of GDP (the rise is somewhat more substantial as a percent of payroll), while CBO expects substantial growth. Specifically, between 2050 and 2089 the Trustees project spending to grow from 6 percent of GDP and 16.9 percent of payroll in 2050 to 6.1 and 18.2 percent, respectively. Meanwhile, CBO projects spending as a percent of GDP to grow from 6.2 percent to 6.9 percent over the same period.

Although differences may result in small part from differing growth projections -- nominal GDP is about 10 percent higher in 2050 under the Trustees' assumptions than CBO's -- the differences are mainly due to demographics.
Specifically, based on the average decline in mortality since 1950, CBO believes life expectancy will grow more quickly than the Trustees estimate (though CBO still assumes slower gains than the 2011 Social Security Technical Panel). Whereas the Trustees assume average mortality will decline by 0.8 percent per year, CBO assumes 1.2 percent per year. Over 25 years, this translates into a one year life expectancy difference, and that gap would widen over time. By having higher life expectancy projections, CBO expects a larger increase in benefits and therefore higher program costs.
Although there is no way to predict with certainty whether CBO or the Trustees are closer, policymakers can take steps to reduce the uncertainty of demographic or economic assumptions. For example, instead of increasing the retirement age by a fixed amount, they could index the Social Security retirement age to changes in longevity. This policy would ultimately lead to a higher retirement age and more savings if CBO is right -- and more savings are needed -- than if the Trustees are correct. Aiming for "robust solvency" can help policymakers reduce the risk that whatever changes they make will be too modest (or too severe) to make the program sustainable.
Policymakers should also take note that both CBO and the Trustees estimate a sizeable gap between spending and revenue for the foreseeable future. Whether it is a 1 or 1.4 percent of GDP gap, reforms will be needed to close it and put Social Security's finances on sound footing.

