Everything You Need to Know About CBO's January 2016 Budget and Economic Outlook
We've published a new chartbook to illustrate the most important facts and figures from this week's report by the Congressional Budget Office (CBO), which shows debt and deficits are now projected to rise much higher than previously projected.
Seven of the key charts are highlighted below.
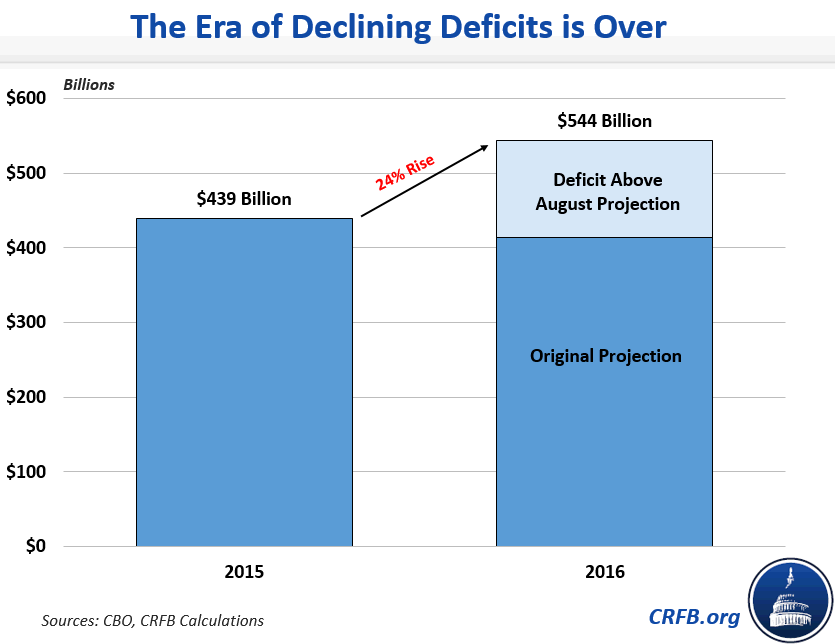
Chart 1: The Era of Declining Deficits is Over
The 2009-2015 era of declining deficits has ended, with deficits rising more than $100 billion from 2015 to 2016. The deficit will now grow by 24 percent from $439 billion (2.5 percent of Gross Domestic Product) in 2015 – the lowest level since 2007 – to $544 billion (2.9 percent of GDP) in 2016.
Over ten years, deficits are expected to be $1.5 trillion higher through 2025 than CBO projected in August. Approximately half of that worsening is due to recent legislation, mainly the result of December’s unpaid-for tax extenders and omnibus legislation.
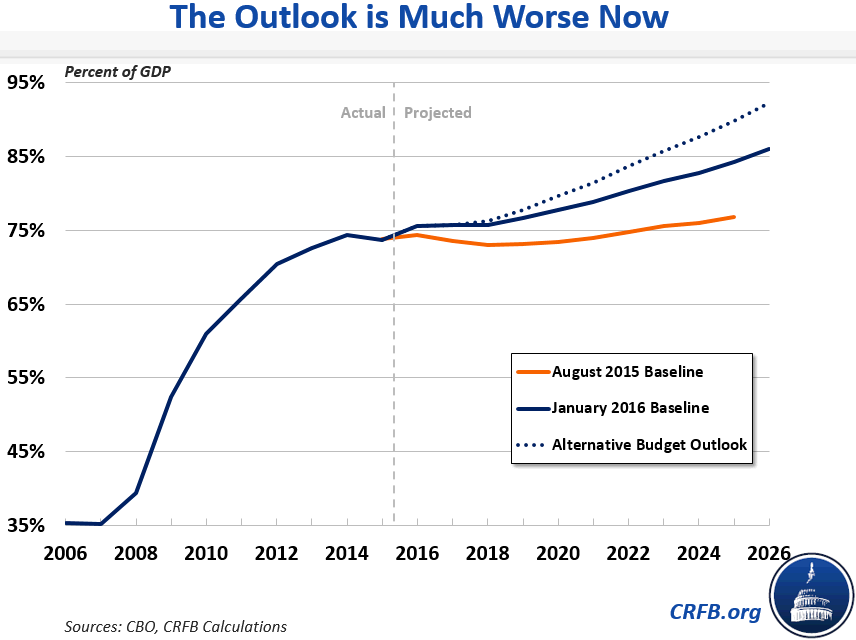
Chart 2: The Outlook is Much Worse Now
CBO projects debt will rise much higher than previously projected, from 74 percent of GDP last year to almost 86 percent of GDP by 2026. Previously, CBO projected debt rising to $21 trillion (77 percent of GDP) by 2025.
The debt could rise even higher to 92 percent of GDP if lawmakers continue making fiscally irresponsible choices: if lawmakers were to fully repeal (and not offset) future “sequester" cuts ($897 billion over 10 years), continue various temporary tax breaks ($327 billion), and repeal the Affordable Care Act taxes ($256 billion) delayed last December.
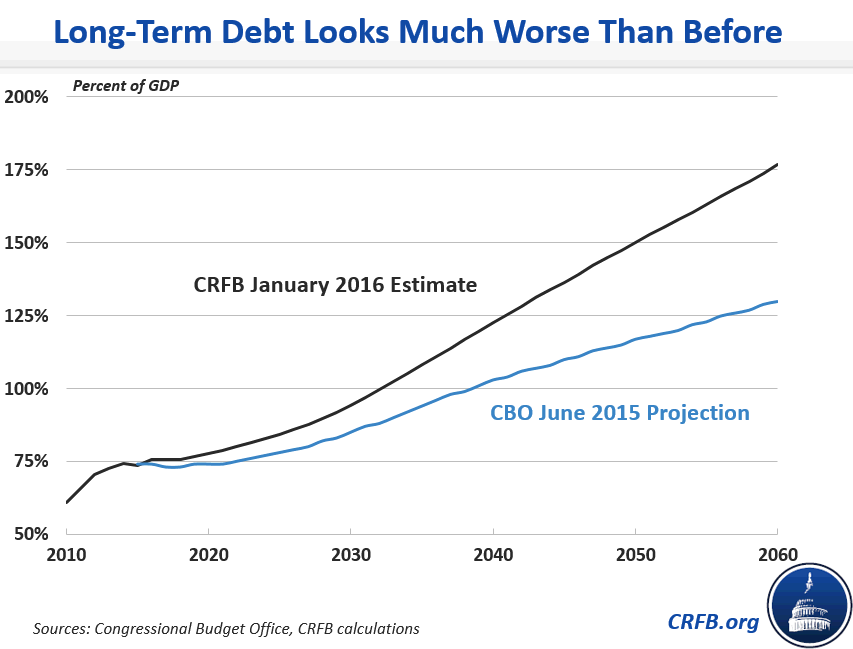
Chart 3: Long-Term Debt Looks Much Worse Than Before
CBO’s full baseline report estimates debt held by the public will grow to 155 percent of GDP in three decades. This number would be much higher than the historical record of 106 percent in 1946 and well above the 110 percent that CBO projected for the mid-2040s last year. Based on CBO numbers, we project that debt will now exceed the size of the economy in the early 2030s (compared to the late 2030s in last year’s projections) and will be twice the size of the economy before 2070, something that would not have occurred in last year’s projection until around the turn of the next century.
Read more in our blog The Long-Term Debt Picture Looks Much Worse As Well.
Chart 4: Gap Between Revenue and Spending
As spending continues to surpass revenues, we dig ourselves into a bigger hole. Social Security and health care spending will continue to rise over the next few decades, as the population ages and health care costs grow. Revenue will also rise nominally but will remain essentially flat as a share of the economy.
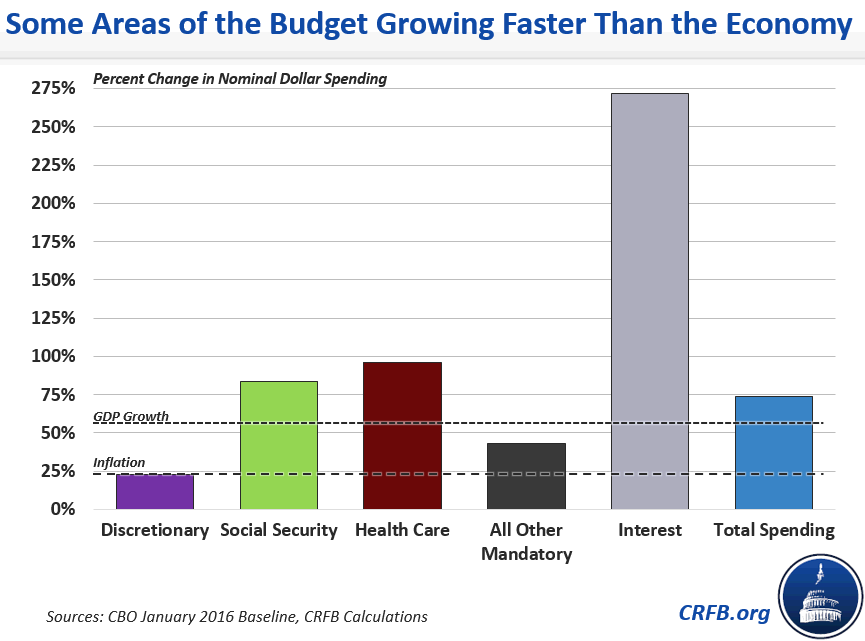
Chart 5: Some Areas of the Budget Growing Faster Than the Economy
Entitlement programs are increasingly contributing to the problem of growing debt, with 83 percent of the $2.7 trillion increase in spending between 2015 and 2026 coming from Social Security, health care, and interest, according to CBO projections. Interest is the fastest growing part of the budget, more than tripling between 2016 and 2026.
Read more in our blog Social Security, Medicare, & Interest Drive 3/4 of Spending Growth.
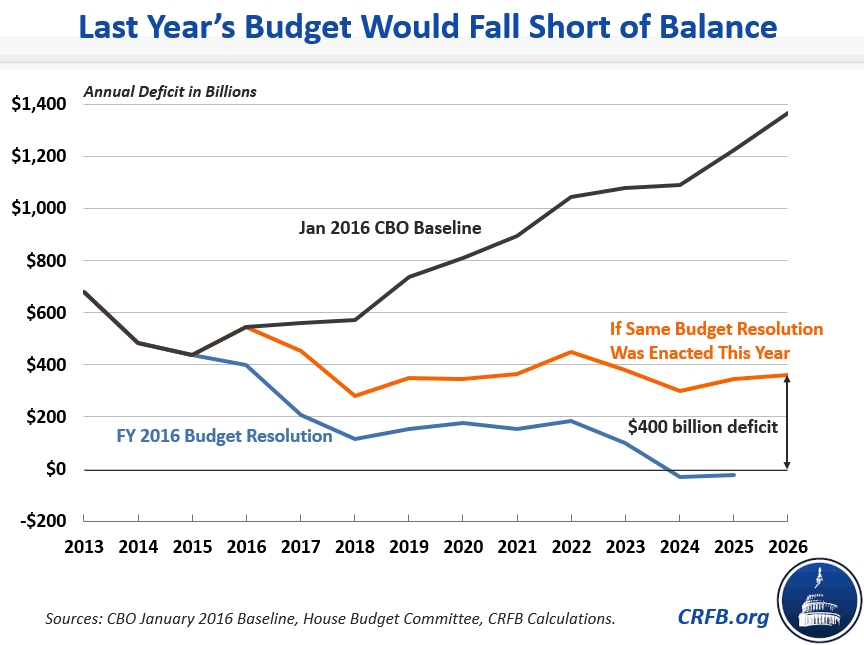
Chart 6: Last Year's Budget Would Fall Short of Balance
The deficit is now expected to be $1.5 trillion worse than projected last year between 2016 and 2025. As a result, last year's congressional budget resolution, which reached balance by 2024, would fall short this year. In fact, enacting the same budget resolution as last year would now lead to a $300 billion deficit in 2024 and a $400 billion deficit in 2026.
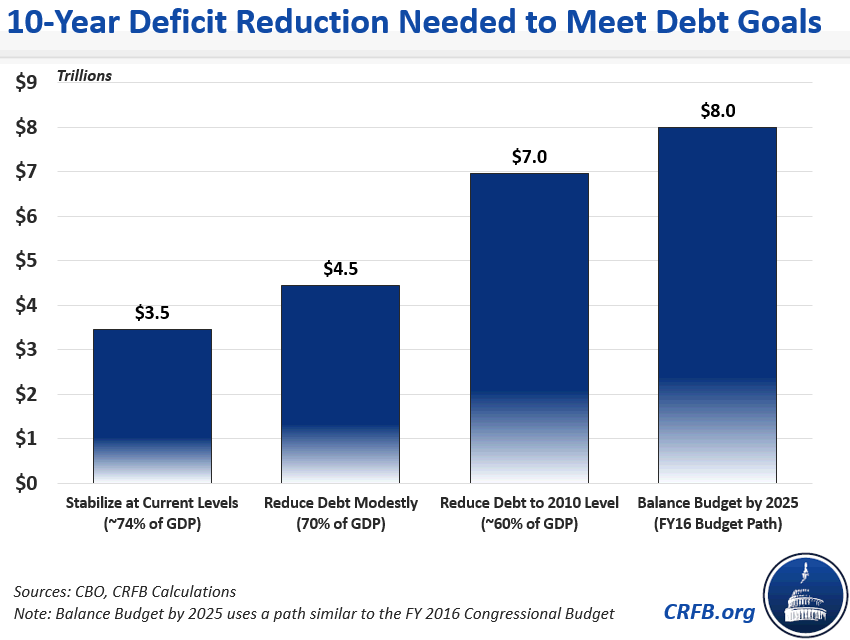
Chart 7: 10-Year Deficit Reduction Needed to Meet Debt Goals
Balancing the budget has become even more difficult, requiring $2.2 trillion more in savings than last year’s congressional budget resolution produced, increasing the total to about $8 trillion. Reaching this goal would require Congress to cut primary spending by 15 percent, raise revenue by 17 percent, or some combination of the two.
Read more in our blog: It Could Take $8 Trillion to Balance the Budget.
The long-term debt problem is daunting enough, and it will be worse if lawmakers continue to pass legislation without offsetting its costs.
See our whole chartbook, including more charts, as a printer-friendly PDF, or see our paper for more detail: Analysis of CBO's January 2016 Budget and Economic Outlook.
