CBO Delivers Good News for the Affordable Care Act
The latest CBO projections show a slight improvement on our fiscal situation over the previous ones made in January, and lower projected health insurance premiums are at the center of that improvement. Not surprisingly, then, the agency's latest estimate of the coverage provisions of the Affordable Care Act improved as well.
The net cost of coverage -- the coverage expansions net of mandate penalties, revenue from the Cadillac tax, and related effects -- dropped by $142 billion over ten years, from $1.35 trillion to $1.21 trillion. Simultaneously, CBO projects that there will be 4 million fewer people uninsured in 2025 than they did in January. There are plenty of different effects at work, so let's take a closer look at what happened with their ACA estimates.
The largest factor, lower private health insurance premiums, comes about as CBO takes into account the slower-than-expected premium growth from 2013 and puts greater weight on the slow growth since 2006. CBO now anticipates a slower bounce back in premium growth than they expected before as the economy continues to recover. As a result, projected 10-year spending on subsidies for health insurance purchased through the exchanges dropped by one-fifth, from $1.06 trillion to $850 billion.
At the same time, though, the lower premiums mean that the Cadillac tax on high-cost insurance plans will now raise $62 billion less than expected, continuing a trend of downward revisions to projected Cadillac tax revenue (the 2023 projected revenue is now 60 percent less than was expected two years ago). The lower premiums also translate to lower revenue as a result of the fact that people losing employer coverage due to the ACA will have less compensation shifted into taxable income (lower anticipated premium growth similarly increased CBO's projections of baseline wages and salaries).
CBO also re-evaluated sources of coverage, determining that about 4 million fewer people would get coverage through the exchanges and the Medicaid expansion while 2 million more people would get employment-based coverage than they previously thought. Some of this change stems from new data CBO received that indicated more people would be working at large employers who are less likely to drop coverage and that more people had employer-provided coverage prior to 2014 than previously thought. Thus, more people would keep employment-based coverage, and fewer people would qualify for Medicaid and the exchange subsidies. The employment coverage effects, in conjunction with lower premiums, means the coverage expansions will raise $81 billion less revenue through the indirect effect of people taking more compensation in the form of taxable income instead of insurance premiums. The lower additional enrollment in Medicaid also lowers program spending by $73 billion.
| Changes in CBO's Affordable Care Act Projections | |
| 2016-2025 Increase/Decrease | |
| January 2015 Net Cost of Coverage | $1,350 billion |
| Exchange Subsidies | -$209 billion |
| Medicaid and CHIP | -$73 billion |
| Small Business Tax Credits | -$4 billion |
| Mandate Penalties | $0 billion |
| Cadillac Tax | $62 billion |
| Indirect Effects of Coverage Provisions | $81 billion |
| Total Revisions | -$142 billion |
| March 2015 Net Cost of Coverage | $1,207 billion |
Source: CBO/JCT
Although the ACA is projected to reduce the number of people who are uninsured in 2025 by 2 million less than before (25 million versus 27 million), incorporating new data, CBO now thinks that 5 million fewer people would have been uninsured in absence of the law, leaving the total number of uninsured people 3-4 million lower than anticipated in January. In other words, the ACA is expected to do less than before to insure people (in part because the new data indicates that there was less to do), but underlying insurance coverage will be greater and by a larger amount.
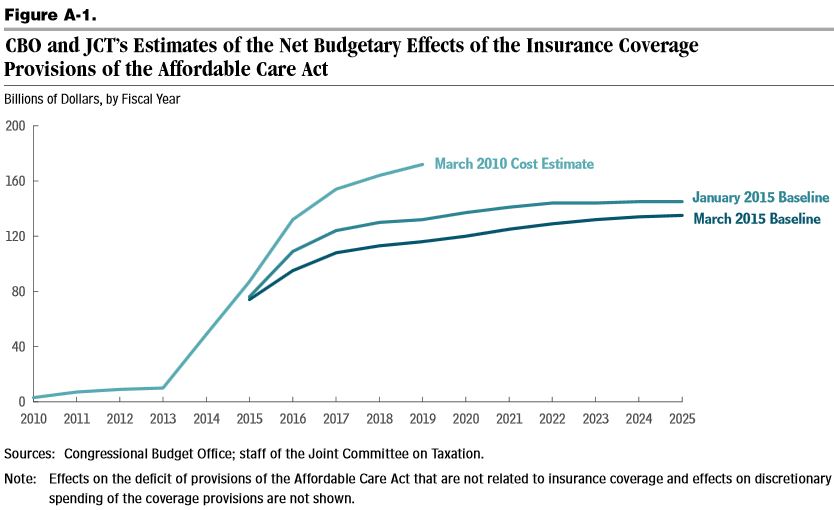
In addition to comparing their projections in March and January, CBO also compares their current projections to the initial ones they made in March 2010. They find that their 2015-2019 projections are now 29 percent lower than they initially thought ($710 billion versus $506 billion), and their 2019 projection is one-third lower ($172 billion versus $116 billion). They attribute these dramatic revisions to a number of sources, including subsequent legislation, changes in economic projections, modeling improvements, the NFIB v. Sebelius Supreme Court decision, administrative changes, incorporation of new data, and the health care slowdown. Notably, though, CBO has not attempted to estimate the budgetary effect of the entire law since 2012, saying that it is too difficult at this point to disentangle the ACA's other provisions from other health care developments since the legislation's passage.
The new projections are certainly good news for the Affordable Care Act and health care spending more broadly, but it does not mean that policymakers should be complacent on health care costs. Health care spending is still projected to increase significantly as the population ages, putting upward pressure on both total and per-person spending in public programs. Lawmakers should take steps to reduce that spending and better ensure that the health care slowdown persists in the future.


