CBO Releases New Baseline Ahead of President's Budget Estimate
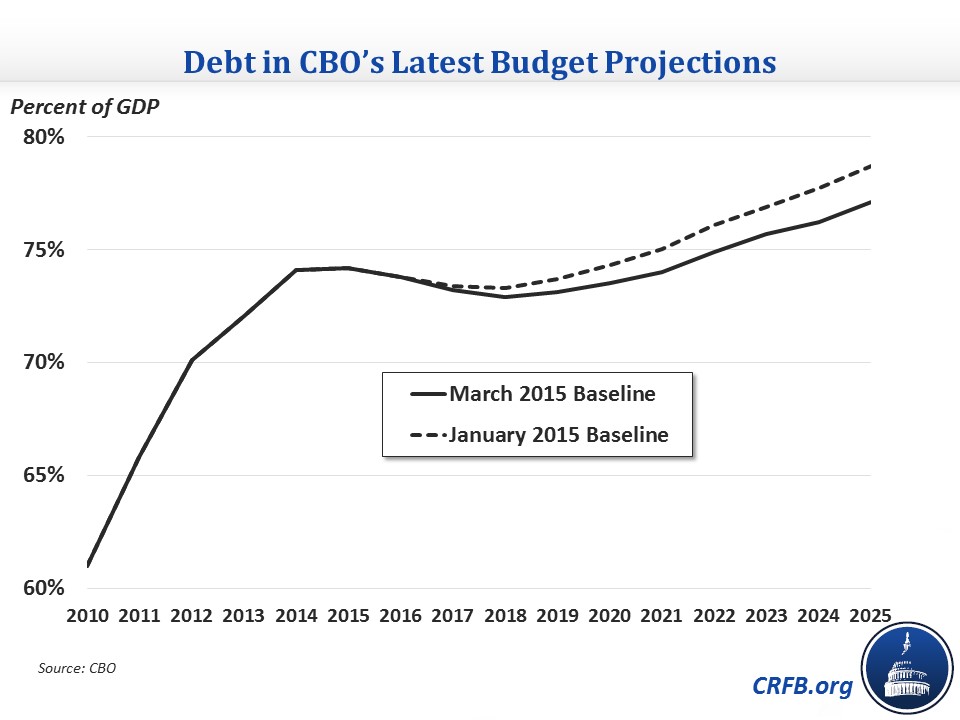
In advance of its scheduled release of an analysis of the President's budget, CBO has updated its budget projections for the next ten years. Their new estimates show a somewhat improved but similar picture to their last baseline in January: slightly falling debt as a share of GDP in the near term but rising debt after that. Debt will dip from 74 percent in 2015 to 73 percent by 2018 but then rise to reach 77 percent by 2025. This blog goes into further detail about CBO's March budget projections and what changed since January.
Over the next ten years, deficits are projected to total $7.2 trillion, or 3.1 percent of GDP. Looking at individual years, though, deficits will be rising throughout most of the period. The deficit will stay around 2.5 percent of GDP through 2018 but rise steadily to 3.8 percent by 2025. These widening deficits drive the rise in debt after 2018, when it increases from a low of 72.9 percent in 2018 to 77.1 percent by 2025. The previous projection had debt reaching nearly 79 percent in 2025.

Leading this worsening outlook is rising spending coupled with only slightly increasing revenue. Spending will rise from 20.4 percent of GDP in 2015 to 22.1 percent by 2025. This increase as a share of GDP is entirely driven by increases in Social Security, health care, and interest spending. At the same time, though, revenue will increase only slightly, from 17.7 percent in 2015 to 18.3 percent in 2025, as growing individual income tax revenue is largely offset by falling corporate revenue and Federal Reserve remittances. Spending and revenue average 21.3 and 18.2 percent of GDP, respectively, over the next ten years, similar to their totals in the January baseline.
| Budget Metrics in CBO's Updated Baseline (Percent of GDP) | |||||||||||
| 2016 | 2017 | 2018 | 2019 | 2020 | 2021 | 2022 | 2023 | 2024 | 2025 | Ten-Year | |
| Outlays | |||||||||||
| March | 20.8% | 20.6% | 20.5% | 20.9% | 21.2% | 21.4% | 21.8% | 21.8% | 21.7% | 22.1% | 21.3% |
| January | 20.8% | 20.7% | 20.7% | 21.1% | 21.4% | 21.6% | 22.0% | 21.9% | 21.8% | 22.3% | 21.5% |
| Revenue | |||||||||||
| March | 18.4% | 18.3% | 18.1% | 18.1% | 18.1% | 18.1% | 18.1% | 18.2% | 18.2% | 18.3% | 18.2% |
| January | 18.4% | 18.2% | 18.1% | 18.1% | 18.0% | 18.1% | 18.1% | 18.2% | 18.2% | 18.3% | 18.2% |
| Deficits | |||||||||||
| March | -2.4% | -2.3% | -2.4% | -2.8% | -3.1% | -3.3% | -3.7% | -3.6% | -3.4% | -3.8% | -3.1% |
| January | -2.5% | -2.5% | -2.6% | -3.0% | -3.3% | -3.5% | -3.9% | -3.8% | -3.6% | -4.0% | -3.3% |
| Debt | |||||||||||
| March | 73.8% | 73.2% | 72.9% | 73.1% | 73.5% | 74.0% | 74.9% | 75.7% | 76.2% | 77.1% | N/A |
| January | 73.8% | 73.4% | 73.3% | 73.7% | 74.3% | 75.0% | 76.1% | 76.9% | 77.7% | 79.0% | N/A |
Source: CBO
The biggest revision is to the health insurance subsidies available through the health exchanges, which were revised down by $213 billion due to lower projected premiums after CBO incorporated 2013 data on private insurers into its model. This downward revision to insurance premiums also drives an $80 billion increase in revenue, because lower employer-paid premiums will result in employees getting more of their compensation in the form of taxable wages and salaries.
Other major changes include a $51 billion downward revision to Medicaid largely due to fewer people enrolling in the Affordable Care Act's Medicaid expansion (since they expect more people to have enrolled in Medicaid absent the law), a $112 billion downward revision to interest spending from lower deficits elsewhere in the budget and longer average maturity of the debt the Treasury Department issues, and a $37 billion increase in student loan costs from the incorporation of more recent data on the program.
| Changes in CBO's Budget Projections | |
| 2015-2025 Deficit Increase/Decrease (-) | |
| CBO January Deficits | $8,108 billion |
| Exchange Subsidies | -$213 billion |
| Medicaid | -$51 billion |
| Interest Spending | -$41 billion |
| Student Loans | $37 billion |
| Legislation | $9 billion |
| Other | -$5 billion |
| Debt Service | -$70 billion |
| Total Spending Revisions | -$333 billion |
| Individual Income Tax | -$98 billion |
| Payroll Tax | -$23 billion |
| Other Revenue | $44 billion |
| Legislation | -$4 billion |
| Total Revenue Revisions | -$80 billion |
| Total Revisions | -$413 billion |
| CBO March Deficits | $7,695 billion |
Source: CBO
Note: Positive numbers denote deficit increase and vice versa
While the newest projections lay slightly more favorable ground for the re-estimate of the President's budget, they still show an unsustainable debt path that policymakers will have to correct. We will see at the end of the week whether the President's plan hits that goal.


