CBO's Alternative Long-Term Budget Projections
Though the Congressional Budget Office's (CBO) latest Long-Term Budget Outlook projects that federal debt held by the public will reach 181 percent of Gross Domestic Product (GDP) by the end of Fiscal Year (FY) 2053, actual debt-to-GDP could be higher or lower. In previous analyses, we showed that debt could reach as high as 222 percent of GDP under a set of fiscally irresponsible policy assumptions or as low as 115 percent of GDP if policymakers restore solvency to the major trust funds. In a new report, CBO analyzed eight additional alternative scenarios, under which debt rises to as low as 132 percent of GDP or approaches 300 percent of GDP by the end of 2053. Specifically, CBO finds:
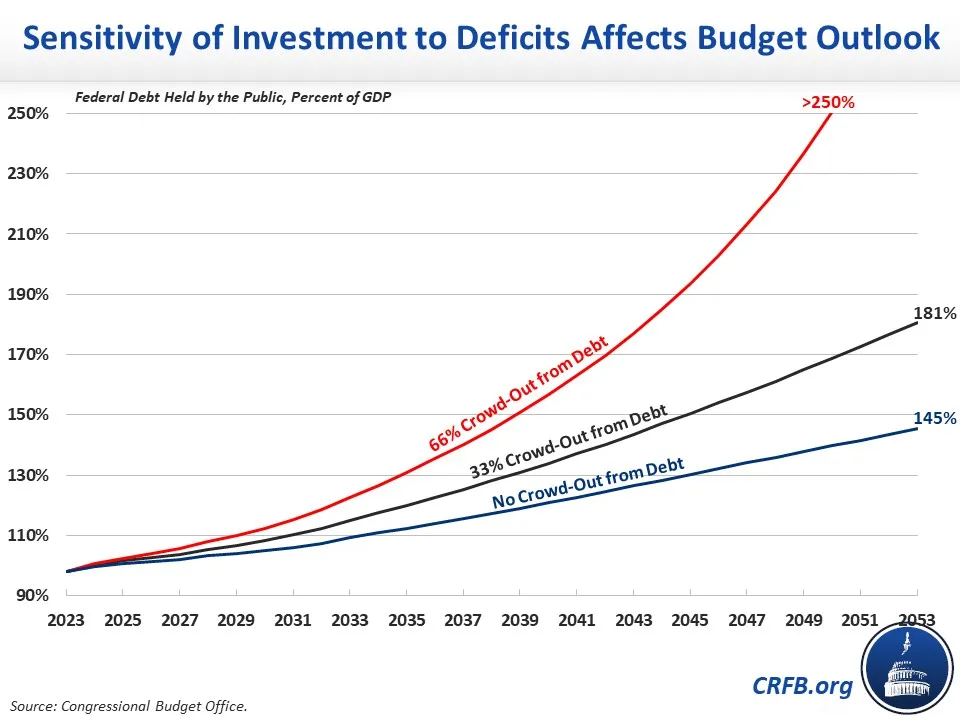
- Debt in 2053 could be as low as 145 percent of GDP or approach 300 percent of GDP, depending on the effect rising debt has on output and interest rates.
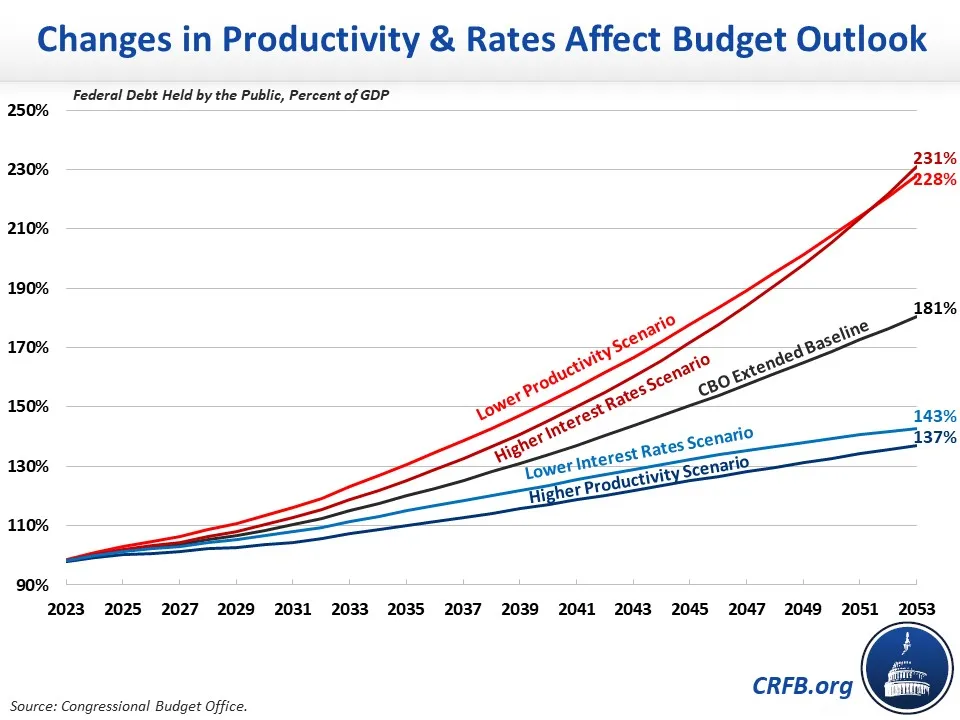
- If interest rates or productivity differ from CBO's projections, debt in 2053 could be as low as 137 percent of GDP or as high as 231 percent of GDP.
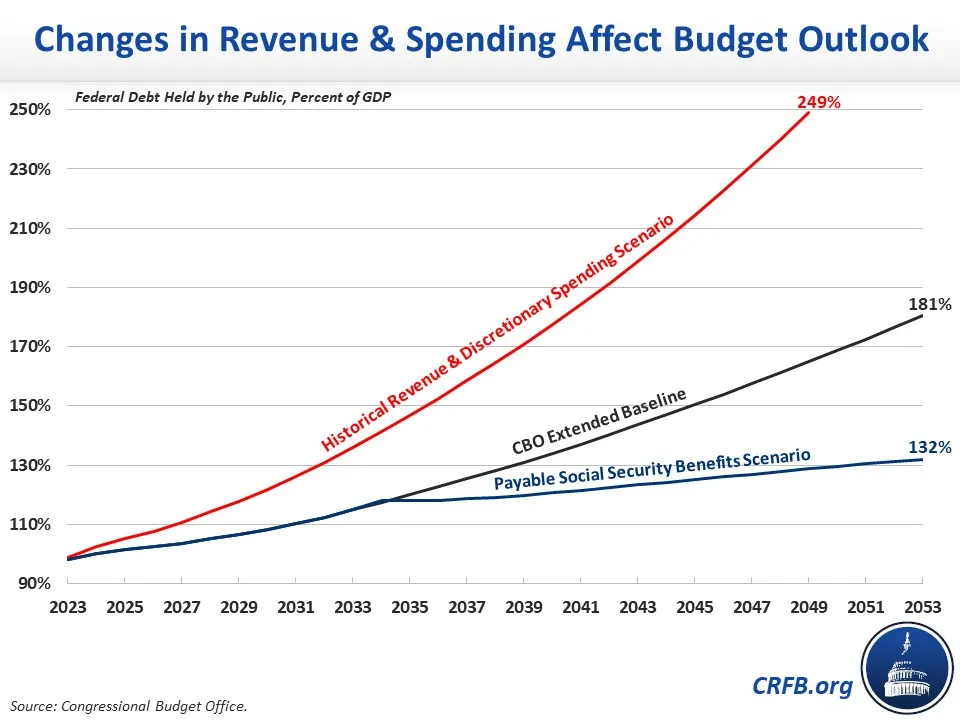
- If revenue and discretionary spending moved toward their historical averages, debt would reach 249 percent of GDP by 2049 and approach 300 percent of GDP by 2053.
- If Social Security spending is limited to incoming revenue upon trust fund insolvency, debt would only rise to 132 percent of GDP by 2053.
In general, these alternative scenarios account for the fact that high levels of deficits and debt crowd out private investment, leading to slower economic growth and higher interest rates. In fact, CBO estimates that every new dollar of government borrowing reduces private investment by 33 cents, which partially explains the projected rise in debt to 181 percent of GDP by the end 2053. If CBO completely ignored the effect of government borrowing on investment, debt would rise to only 145 percent of GDP by 2053. Under such a scenario, 2053 GDP would be 5 percent higher and interest rates 0.9 percentage points lower than in CBO's baseline.
On the other hand, if crowd-out were twice as strong – meaning every new dollar of government borrowing reduces private investment by 66 cents – debt would exceed 250 percent of GDP by 2050 and would approach 300 percent of GDP by the end of 2053 (CBO ends its simulations when debt exceeds 250 percent of GDP). Under such a scenario, GDP in 2050 would be 12 percent lower and interest rates 2.5 percentage points higher than in CBO's baseline.
Assuming CBO's standard 33-cent crowd out, changes to fiscal policy itself can also meaningfully change the debt trajectory – both by directly increasing or reducing deficits and also by influencing economic growth and interest rates.
Although CBO projects that the combined Social Security trust funds will be insolvent by 2033, its baseline assumes continued full Social Security spending despite the legal requirement that benefits must be cut to match trust fund revenues upon insolvency. If Social Security spending were limited to dedicated revenues upon insolvency – similar to under our TRUSTGO Scenario – debt would rise to only 132 percent of GDP by the end of 2053, compared to 181 percent under CBO's baseline. Under that scenario, Gross National Product (GNP) in 2053 would be 5 percent higher and interest rates 0.5 percentage points lower than in CBO's extended baseline.
On the other hand, CBO projects that if revenue was held constant at its 30-year historical average of 17.2 percent of GDP (rather than rising to 19.1 percent of GDP by 2053) and discretionary spending grew at its 30-year historical average of 7.1 percent of GDP (as opposed to totaling 5.4 percent of GDP by 2053), debt would total 249 percent of GDP by 2049 and likely approach 300 percent of GDP by the end of 2053. In that scenario, interest rates would be higher and GDP lower than in CBO's baseline, though the report does not say by how much.
CBO also runs its baseline under different underlying economic assumptions. In CBO's extended baseline, productivity grows an average of 1.1 percent per year. CBO estimates that if productivity grew 0.5 percentage points faster, debt would total 137 percent of GDP by the end of 2053, compared to 181 percent of GDP under its baseline. On the other hand, if productivity growth is 0.5 percentage points lower, debt would total 228 percent of GDP by the end of 2053.
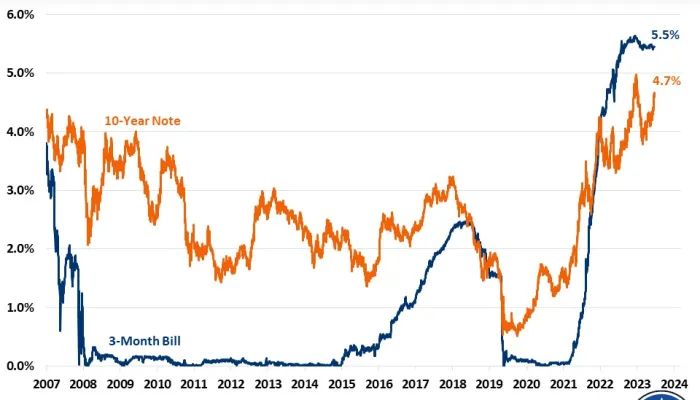
CBO projects the average interest rate on federal debt held by the public will rise from 2.7 percent this fiscal year to 4.0 percent by 2053. If underlying interest rates grew 5 basis points faster per year to 5.8 percent by 2053, inclusive of macroeconomic feedback, debt would total 231 percent of GDP by the end of 2053. If underlying interest rates grew 5 basis points slower than under CBO's baseline to 2.2 percent by 2053, inclusive of feedback, debt would total 143 percent of GDP by the end of 2053.
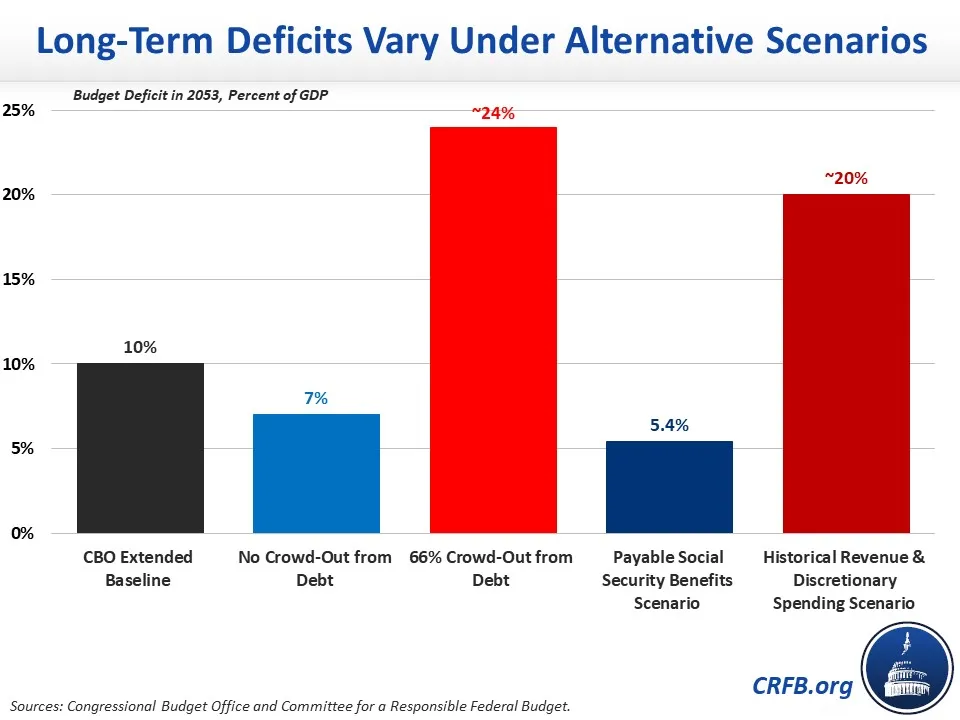
Long-term deficits would differ tremendously under these scenarios. While the budget deficit would reach 10 percent of GDP by 2053 under CBO's baseline, it would only reach 7 percent of GDP without the negative economic effects from rising debt, but would likely exceed 24 percent of GDP if the crowd-out effect were twice as strong as under CBO's baseline. With Social Security benefits limited to revenue plus trust fund reserves, CBO estimates deficits would reach 5.4 percent of GDP by 2053. If revenue and discretionary spending returned to their historical averages, we project deficits would reach about 20 percent of GDP by 2053.
In the final analysis, deficits and debt may differ substantially from CBO's baseline projections. Yet even under their most optimistic scenario, CBO shows that debt will continue to grow as a share of the economy over the long-term. The faster debt grows, the more it will slow economic growth and boost interest rates – which not only lowers income and boosts costs for households, but also further undermines U.S. fiscal sustainability. Lawmakers should take actions to substantially improve the nation's fiscal trajectory.
What's Next
-
Image
-
Image
-
