CBO: Social Security Trust Fund To Be Exhausted 1 Year Earlier, in 2030
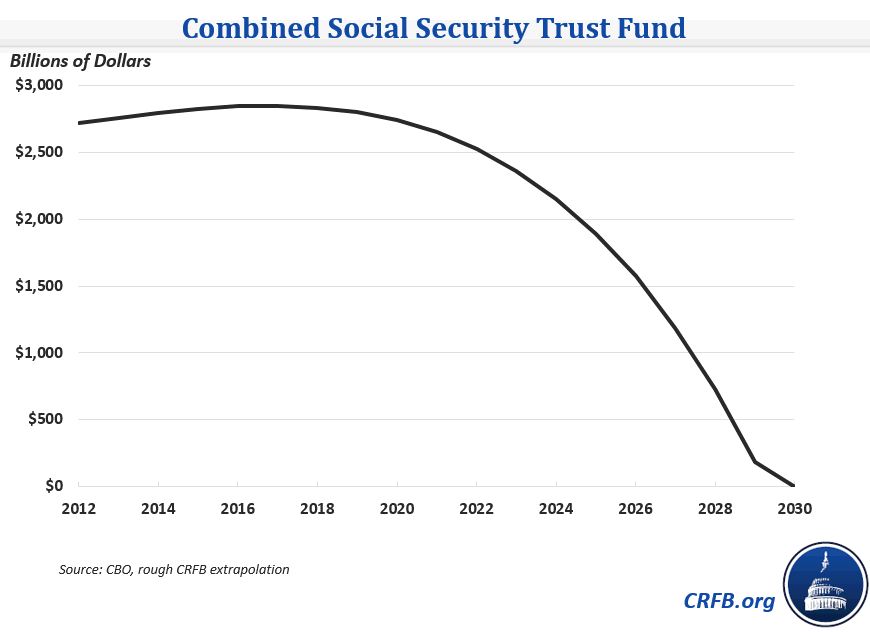
One of the biggest stories of last year's long-term outlook was the deterioration in Social Security's financial picture. Largely due to CBO's expectation that people will live longer, its estimate of the 75-year shortfall grew by more than half from their 2012 outlook – from 2.1 percent of taxable payroll to 3.4 percent (1.2 percent of GDP). CBO predicted that the combined Social Security trust funds would run out of money by 2031, two years earlier than predicted by the Trustees. This year's projections show a further deterioration in Social Security's financial situation, with the 75-year shortfall now projected at 4.0 percent of payroll (1.4 percent of GDP) and the trust fund expected to be exhausted by 2030. The Disability Insurance trust fund faces a more immediate issue, with its exhaustion date set for FY 2017.
This year's change is not due to demographics – which look similar to last year – but two broader economic factors: lower interest rates and slower short-term economic growth. CBO has revised its estimate of long-term interest rates down by about 0.5 percentage points. Lower interest rates mean lower debt payments and are actually good for the budget overall but cause estimates to place a greater weight on later years when Social Security is running greater deficits. Thus, the higher weight placed on later years worsens the actuarial balance (and creates a lower return to the assets in the Trust Fund) and is responsible for about half of the change.
The second major change is from changes in ten-year projections since last September, mostly from the February 2014 outlook when CBO revised down its economic growth projections. The resulting forecast had less income tax and payroll tax revenue, which contributed to the worsening Social Security balance by reducing Social Security payroll tax revenue by $230 billion over ten years. This factor represents about 0.2 percentage points of the change in the actuarial shortfall. The remaining 0.1 percentage point comes from technical factors that CBO does not specify.
| Change in Social Security Long-Term Projections | ||
| 75-Year Change (Percent of Payroll) | ||
| September 2013 Shortfall | 3.4% | |
| Economic Projections (Interest Rates) | +0.3% | |
| Ten-Year Projections (Revenue) | +0.2% | |
| Other Changes | +0.1% | |
| July 2014 Shortfall | 4.0% | |
Source: CBO
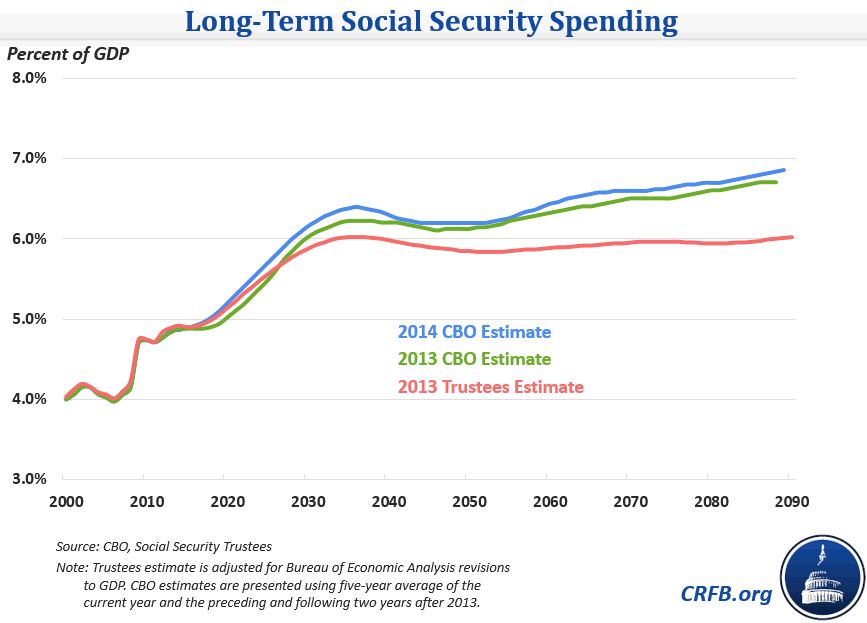
As a share of GDP, Social Security spending is slightly higher in this year's projection, a change that CBO attributes to lower GDP. In this year's projection, Social Security peaks at 6.4 percent of GDP in the mid-2030s before stabilizing for a few decades then increasing to 6.9 percent of GDP by the end of the projection window. Last year's projection showed a spending peak in the mid-2030s at 6.3 percent and the end of the projection window at 6.7 percent of GDP. Meanwhile, revenues will stay roughly constant as a percent of GDP for at least the next 25 years around 4.5 percent of GDP.
Social Security looks somewhat worse in this year's outlook, although unlike last year, the change is due to broader economic factors rather than assumptions about the program itself. Still, both the Trustees and CBO makes clear that lawmakers will have to start soon on changes to the program to keep it solvent for the long term.