The $900 Billion Slowdown in Federal Health Care Spending
With April's updated projections from the Congressional Budget Office (CBO), spending on major federal health care programs (Medicare, Medicaid, and the Affordable Care Act's exchange subsidies) has now been revised downward by $900 billion, or 0.4 percent of GDP, cumulatively from 2011 through 2021, just since their March 2011 projections. Buoyed by a 23 percent drop in the cost of Medicare Part D and a 15 percent decline in the projected costs of the Affordable Care Act's (ACA) new coverage through Medicaid and the exchanges, this remarkable slowdown has been a bright spot amidst an otherwise still dim fiscal outlook.
While the slowdown has garnered much attention, much less writing has focused on pinpointing where the downward revisions have occurred. Relative to the size of the program, the largest reduction actually occurred in Medicare Part D, with nearly the largest nominal dollar reduction in spending despite being very small compared to major federal health care programs. This downward revision is in large part due to the broader slowdown in prescription drug costs stemming from the so-called "patent cliff," as a number of widely used, high-cost drugs have come off patent recently. The program's costs have also consistently been revised downward since its implementation. In addition, in the most recent baseline, CBO revised down the cost of the Low-Income Subsidy (LIS) based on the incorporation of new analysis.
Other than Part D, Medicaid spending outside the ACA was also revised down by a sizeable amount, largely as projected per-capita spending on aged and disabled beneficiaries has declined. The costs of the ACA's Medicaid expansion and exchange subsidies have been revised down by similar amounts due in large part to the Supreme Court decision (NFIB v. Sebelius) and the recent downward revision of projected premiums in the exchanges, respectively. For other Medicare spending, Part A has been revised down significantly, while Part B has actually been revised up by about half as much (in part due to the declining cuts mandated by the Sustainable Growth Rate formula). The sequester has also played a role in decreasing projected Medicare costs (but is no longer set to have much impact on the Affordable Care Act in the wake of recent administrative actions).
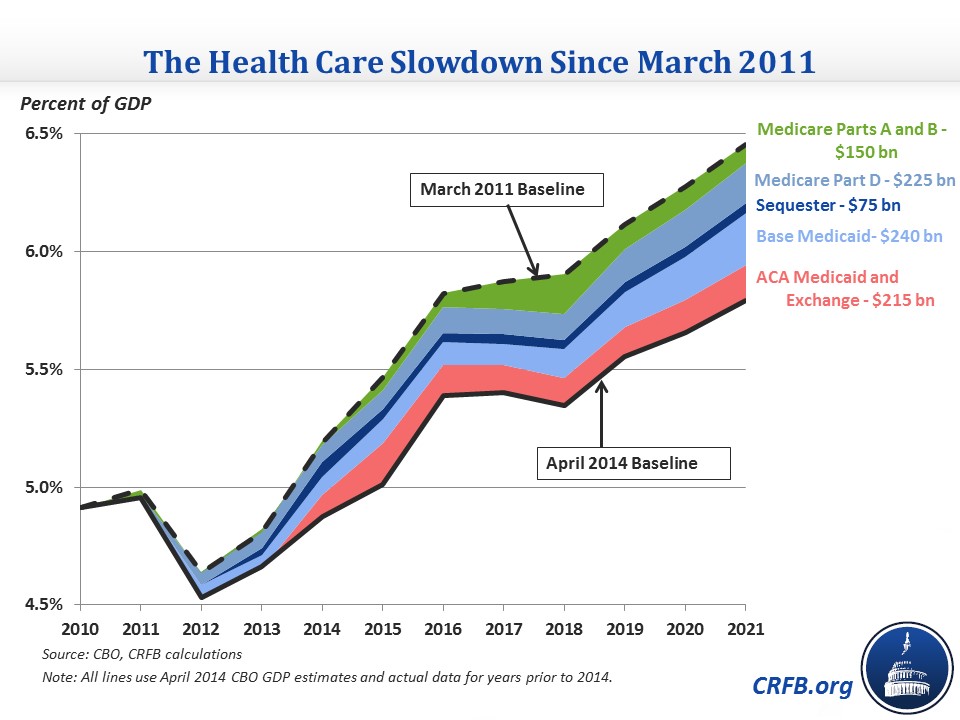
Another way to look at the source of revisions is by what policymakers actually did to bring them about. As you can see in the graph below, the main legislative changes other than "doc fixes" – the sequester and a few modest changes to the ACA – accounted for only a small fraction of the drop in health care spending. And the Supreme Court decision to make the ACA's Medicaid expansion optional similarly only caused a small portion of the slowdown. Most of the difference, therefore, is the result of economic and technical changes to projections.

The above graphs show the differences between the two baselines as a percent of GDP using the same year's (2014) GDP numbers (therefore really illustrating the change in nominal dollar projections). However, a portion of the drop in federal health care spending as a percentage of GDP actually stems from downward revisions to GDP projections since 2011. Adjusting the 2011 estimates for the Bureau of Economic Analysis's GDP revisions, it is apparent that roughly one-third of the difference shown above is due to different GDP numbers.

Breaking down the revisions compared to the size of each program (below) can help us pinpoint where the largest relative changes have been made. In that sense, the projections for Medicare Part D and the ACA clearly stand out as having undergone the largest downward revisions. Other categories of spending have seen relatively small revisions in comparison, even if they are similar in terms of absolute impact.

Another interesting comparison is to look at how much federal health care spending has changed since before the enactment of the Affordable Care Act. The last pre-ACA CBO baseline was in March 2010 and projected net spending on Medicare and Medicaid at $1.34 trillion in 2020. The April 2014 baseline, though, actually estimates spending on those programs plus the ACA's exchange subsidies in 2020 will be $70 billion lower than before the ACA was even enacted, at $1.27 trillion. Note that the most recent comprehensive estimate of the ACA had it increasing federal health spending, on net, by $145 billion in 2020 (including the revenue effect of the exchange subsidies), but that increase has been outdone by the declining projections of federal health spending since then.

The health care spending slowdown is great news for the budget, but it is still unclear whether it will continue to persist over the longer term. Two studies released in the past month suggest that some of the broader trends that have helped the budget may be reversing, but it is still too early to tell whether the overall slowdown is due more to the weak economy or structural factors. Even a small percentage of the slowdown being structural and continuing would greatly help our fiscal picture, and lawmakers should work to fortify the structural changes that are paying dividends.


