Tax Cuts Don't Pay For Themselves
While policymakers are gearing up to address tax reform this fall, some have advocated for abandoning true reform and instead focusing solely on tax cuts. To combat arguments that such cuts will balloon the national debt, tax cut advocates have argued that the cuts could pay for themselves, largely through faster economic growth. Advocates point to tax cuts in 1981 and the early 2000s to make this case.
However, this claim is false. Tax cuts don’t pay for themselves.
While well-designed tax cuts may grow the economy (often not as much as tax reform), there is no case in which they could grow the economy enough to be self-financing. At best, tax cuts can finance a fraction of their costs through faster growth – and maybe not even that.
In this paper, we show:
- There is no theoretical basis to suggest tax cuts could be self-financing. To do that, the economy would need to grow by $5 to $6 for every $1 of tax cuts.
- There is broad consensus among economic models that future tax cuts won’t pay for themselves. Some models find tax cuts would be partially self-financing, while others find the economic feedback would actually increase the deficit effect of tax cuts.
- Past tax cuts in 1981 and the early 2000s have led to widening budget deficits and lower revenue, not the reverse as some claim.
Instead of relying on magic bullets and fairy dust to pay for tax cuts, policymakers should ensure rate reductions do not add to the debt. Instead, they should focus on pursuing comprehensive tax reform as has been proposed by numerous commissions, committees, and tax experts from across the political spectrum.
By repealing tax preferences, broadening the tax base, and reducing rates, tax reform has the potential to reduce distortions, improve simplicity and fairness, and grow the economy more – and in a much more sustained way – than tax cuts.
In 1986, Republicans and Democrats came together to agree on a package that cut some tax rates almost in half but also broadened the base enough to ensure revenue neutrality. This model will do more to grow the economy – especially for future generations – than simple tax cuts.
At Current Rates, Tax Cuts Can’t Produce Enough Growth to be Self-Financing
While well-designed tax cuts can promote economic growth that leads to “feedback” revenue, it is not realistic for this additional revenue to be close to as large as the initial tax cut. Since the federal government collects only a fraction of funds from any additional economic activity, the added economic growth would need to be many times larger than the initial revenue loss.
Currently, the effective marginal tax rate on added economic activity is about 25 percent, meaning that for every dollar of economic growth the government collects about a quarter through higher income, payroll, and other tax collections.
Higher growth also results in higher spending on Social Security, Medicare, and especially on interest costs – since interest rates tend to rise with expected growth rates. After a decade, the nonpartisan Congressional Budget Office (CBO) estimates this will cost roughly one-twentieth of the gains from growth. The result is that, on net, the federal government will only capture about 20 percent of the gain from economic growth. Thought of another way, every $1 of tax cuts would have to produce at least $5 of economic activity to be self-financing.
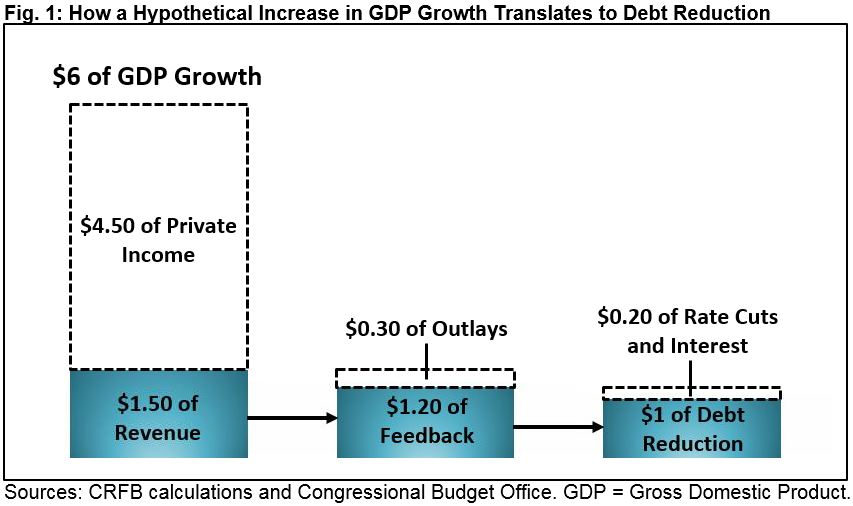
The actual growth effect of tax cuts would likely need to be even higher for two reasons. First, tax cuts would lower marginal tax rates and thus lower the revenue captured from additional economic activity. Second, tax cuts will likely add to the debt – at least in the early years – leading to both higher interest rates and a higher stock of debt on which interest is paid.
Therefore, large tax cuts may need to produce $6 or more of economic activity for every $1 of cuts to be self-financing.
Even the most ardent supporters of tax cuts would be hesitant to argue that they can produce economic activity 5 to 6 times in excess of their cost. For context, in 2005 CBO estimated that an across-the-board 10 percent income tax cut might produce -$0.10 to $1 of GDP for every dollar of cuts. A 2005 JCT study on various ways to cut $500 billion in taxes found an economic return ranging from $0.04 to $1.25 for every $1 of cuts, depending on the type of tax cut. Even the tax cut believed to be most pro-growth (expensing) by the group with the most pro-growth model (Tax Foundation) is only estimated to produce about $2.35 of GDP for every $1 cut.
No Reasonable Economic Model Shows Tax Cuts Paying for Themselves
Theory aside, there is no evidence that large tax cuts could pay for themselves. At best, they would offset a relatively small fraction of the initial revenue loss. At worst, they may lose more revenue.
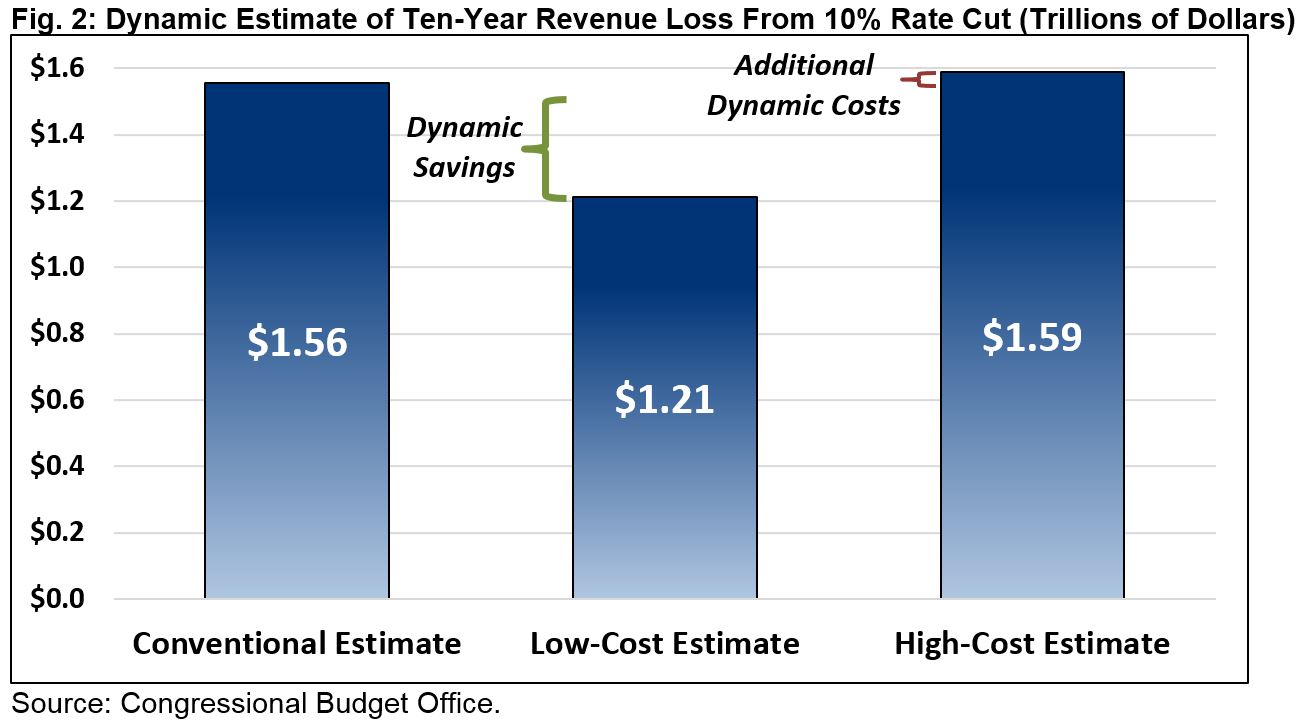
As referred to above, CBO evaluated the potential impact of a 10 percent cut in individual marginal tax rates using a number of different models in 2005. They found that, at best, the added economic growth would offset one-quarter of the ten-year cost of the initial tax cut, and this scenario assumed that future tax increases would be enacted to offset the cost. At worst, CBO concluded the tax cut would slow economic growth and increase the cost slightly (by 3 percent).
Outside groups with their own tax models have more varied conclusions, but few if any find that tax cuts are fully self-financing.
The most optimistic estimates that we are aware of come from the Tax Foundation, whose model assumes no negative impact from higher debt and very high responsiveness of investment decisions to effective tax rates. The Tax Foundation estimates a 10 percent individual income tax cut would pay for one-eighth of its cost, and a 10 percentage point corporate tax cut would pay for three-fifths of its cost.
Most other estimators, who incorporate the effects of higher debt, estimate much smaller amounts of feedback. For example, the Tax Policy Center modeled the individual and business tax cuts put forward by the Trump Administration (excluding possible revenue-raisers) and found that economic growth would offset only 2 percent of the ten-year cost. In the second decade, they actually found the Trump tax cuts would be 5 percent more costly with economic feedback included.
The Penn-Wharton Budget Model developed by the University of Pennsylvania’s Wharton School scored the same plan and found it would actually cost more when dynamic feedback is incorporated. Specifically, it estimates that the economic feedback from the Trump Administration’s tax cuts would increase the ten-year cost of the tax cut by 6 percent and increase the second decade cost by 14 percent.
Past Tax Cuts Have Led to Lower Revenue
When the theory and analysis show tax cuts will not pay for themselves, some advocates look to historic examples – especially arguing that the 1981 and 2001/2003 tax cuts paid for themselves. In reality, virtually all tax cuts in U.S. history have lowered revenue.
William Gale and Andrew Samwick in 2016 surveyed studies of actual individual income tax cuts – as well as simulations of possible tax cuts – and their effects on economic growth. They summarized that most studies found either only a very small positive effect or a negative effect on growth due to the deficit-financed nature of the tax cut. According to the studies and simulations, it is not clear whether individual tax cuts increase growth at all, let alone by enough to pay for their initial cost.
Looking specifically at the performance of revenue after the 1981 and 2001/2003 tax cuts confirms this. Advocates point to the fact that nominal or inflation-adjusted revenue levels rose after these tax cuts. However, this is the wrong measure – revenue almost always rises as a result of growing real wages and income (as well as inflation in the case of nominal revenue).
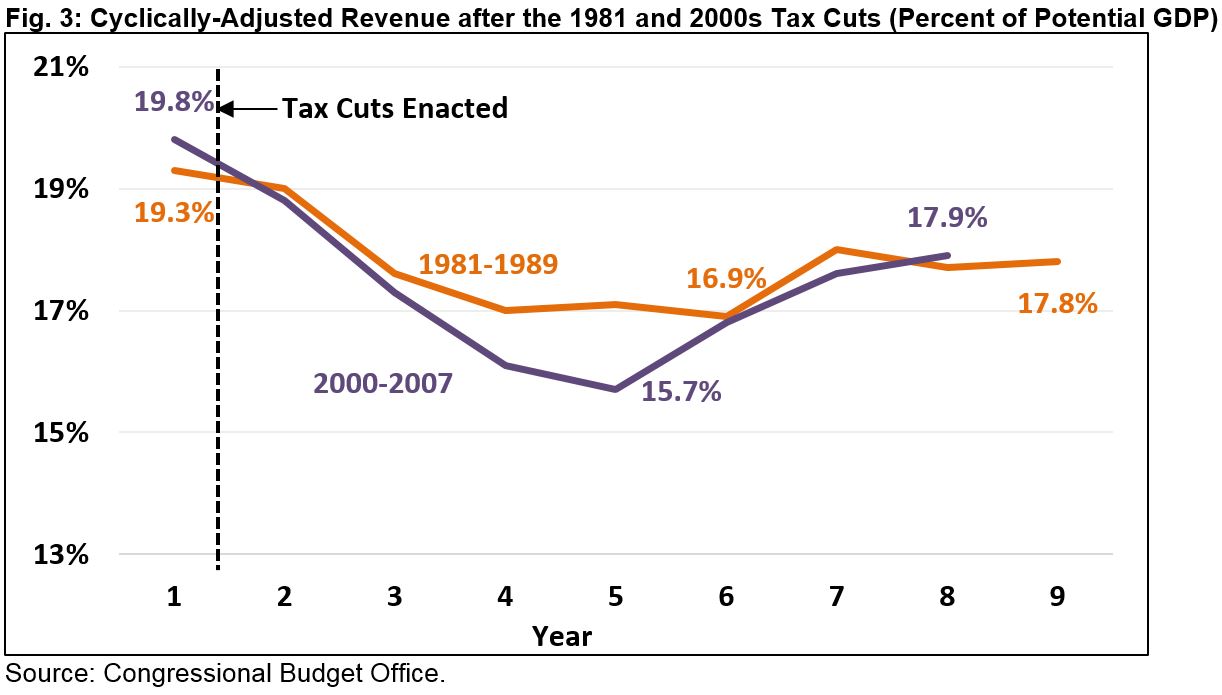
Looking at revenue as a share of potential GDP, which uses cyclical adjustments to account for recessions, one can see very clearly the effects of these tax cuts on revenue.
Prior to the 1981 tax cuts, cyclically-adjusted revenue totaled 19.3 percent of potential GDP. After 1981, it fell precipitously to a low of 16.9 percent of GDP in 1986 before rising to 17.8 percent – still well below the pre-cut levels by 1989. Similarly, revenue prior to the 2001/2003 tax cuts totaled 19.8 percent of GDP. After the tax cuts, it fell to a low of 15.7 percent in 2004 before rising to 17.9 percent by 2007 – again remaining well below the pre-tax cut levels.
Importantly, even looking at revenue as a share of GDP does not really describe how the tax cuts affected revenue. A proper analysis would compare actual revenue levels to what they otherwise would have been. While producing a perfectly accurate counterfactual is impossible, CBO has produced several retrospective analyses that show how and why revenue diverged from their projections. With regards both the 1981 and 2001/2003 tax cuts, CBO found that actual revenue collection was much lower than what had been projected prior to the tax cuts passing.
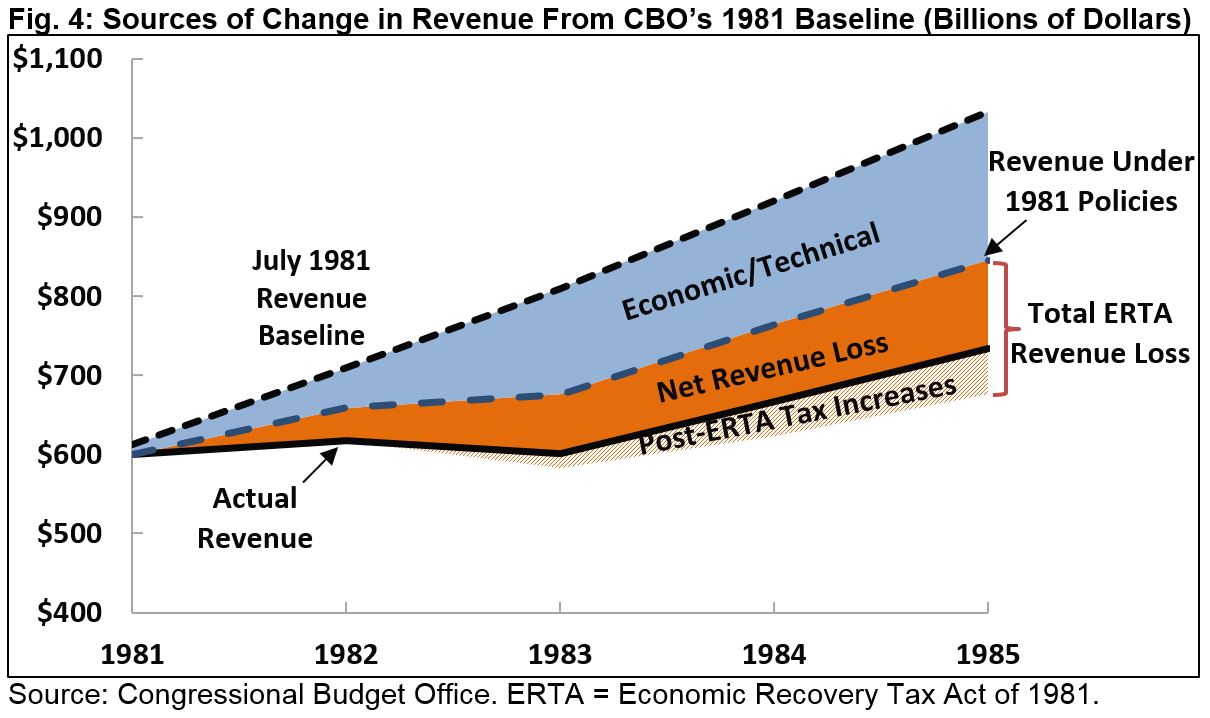
In 1985, CBO produced an analysis that compared its 1981 budget projections with what actually happened in President Reagan’s first term. They found that revenue levels in 1985 were $298 billion (29 percent) lower than had been projected in 1981. This revenue loss is double what CBO and the Office of Management and Budget estimated from the 1981 tax cuts, because of economic and technical revisions. While these revisions were in large part due to the unexpected recession and slowdown in inflation in the early 1980s, they make clear that revenue did not increase due to the 1981 tax cut.
Indeed, the 1981 tax cuts were such a drain on revenue that lawmakers from both parties came together to reverse about one-third of them in 1982. Further revenue-increasing legislation was passed under Presidents Reagan and Bush in 1983, 1984, 1987, and 1990; pro-growth but revenue-neutral tax reform was passed in 1986, and further tax increases came under President Clinton in 1993.
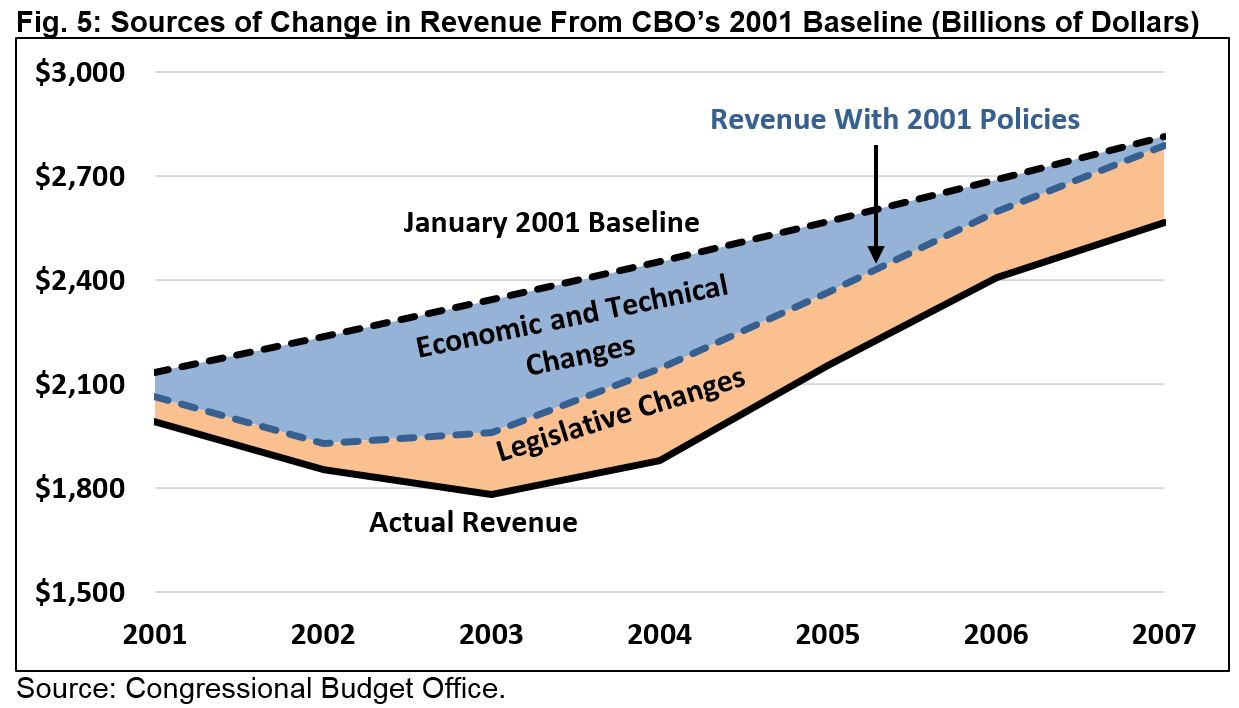
CBO produced a similar analysis in 2012 for the 2000s, showing how actual budget outcomes, including revenue, differed from its January 2001 budget projections. The agency shows that revenue fell short of projections by $2.6 trillion (15 percent) in the 2001-2007 period (we end in 2007 since that was the end of the 2000s expansion). This revenue loss was also double the amount that CBO expected from the tax cuts alone due to economic and technical revisions. Like the 1980s, CBO did not anticipate the 2001 recession, but the estimate clearly shows that the tax cuts didn’t cause an increase in revenue and were a particularly big factor in lower-than-expected revenue once the economy recovered.
No matter how one looks at it, past tax cuts lost revenue. This outcome shouldn’t be a surprise: tax cuts simply don’t pay for themselves.
Conclusion
Reducing tax rates can have a number of advantages, especially on the corporate side where the United States imposes among the highest rates in the world. But any rate reductions must be fully paid for both to prevent a worsening of an already unsustainable debt situation and to ensure the tax code is as efficient, fair, and pro-growth as possible (see Tax Reform Should Not Add to the Debt – Here’s 5 Reasons Why).
There is no way to avoid the tough choices involved in passing tax reform. Tax cuts do not pay for themselves – they do not even come close to paying for themselves.
As we show, in order to pay for itself, every dollar of tax cuts would need to produce five to six dollars of added economic activity – an impossible task in the current context. This is why nearly all economic models find that tax cuts will at best pay for a fraction of their costs through faster economic growth and at worst may slow growth and further reduce revenue. Actual experience with tax cuts in recent decades verifies this, as both the 1981 and early 2000s tax cuts led to a significant reduction in revenue.
Instead of pursuing tax cuts that will surely lose revenue, policymakers should pursue tax reform that is at least revenue-neutral. Designed properly, such reform could lead to faster economic growth and thus somewhat lower levels of debt.
It has been over three decades since Washington last enacted true responsible tax reform. The time has come to do it again.


