Taking The Reformer For a Spin
CRFB's latest interactive tool "The Reformer" is a handy game that allows users to design their own Social Security plan. Users can select from a wide variety of benefit and revenue changes to make the system sustainably solvent. The tool then shows the effect on the program's finances and benefit and tax levels.
To demonstrate this, we took The Reformer for a test drive by trying out various Social Security plans that have already been proposed. Importantly, policies in the simulator are not exactly the same as those we estimated, particularly for phase-ins. In addition, The Reformer can't pick up every interaction between policies, so the results should be viewed as rough but in the neighborhood.
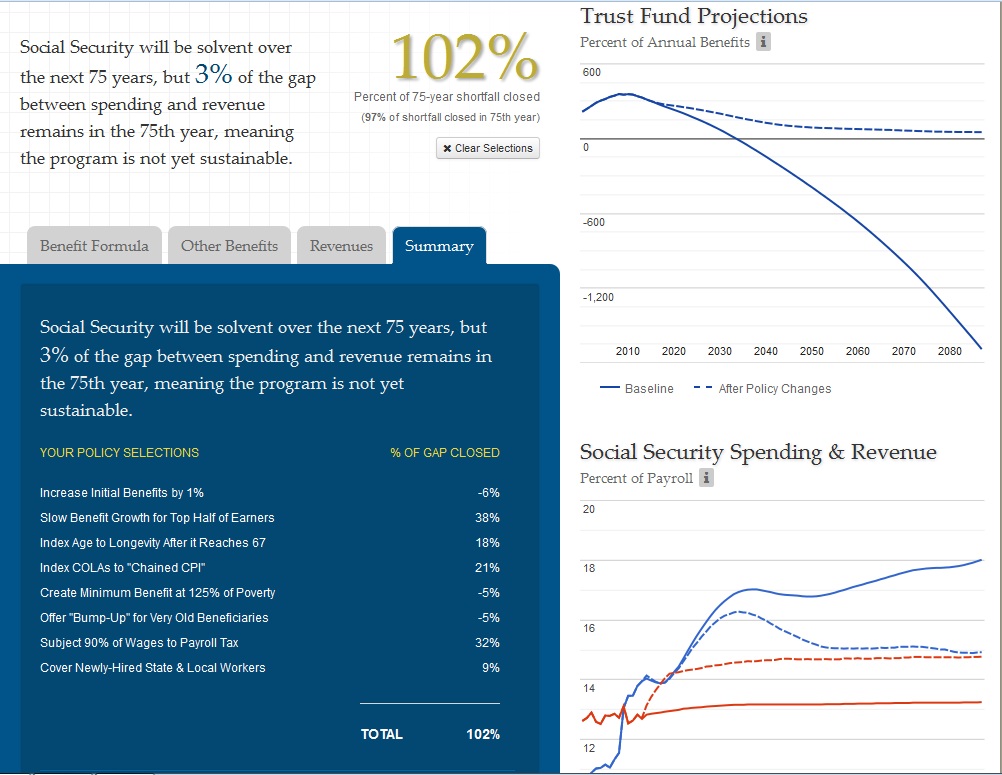
First up is the Simpson-Bowles plan. That plan slows initial benefit growth for the top half of earners, indexes the retirement age to longevity, switches to the chained CPI, creates a minimum benefit and old-age bump up, raises the payroll tax to cover 90 percent of wages, and includes state and local workers in the system. The plan also included a "hardship exemption" for the retirement age which we approximated in size with a 1 percent benefit increase. Plugging those policies into the simulator closes 102 percent of the 75-year shortfall and 97 percent of the shortfall in the 75th year. It reduces scheduled benefits by 9 percent, increases payable benefits (benefits taking into account trust fund solvency) by 16 percent, and increases taxes by 11 percent in 2050. Note that the plan now falls modestly short of sustainable solvency under the latest projections, which is part of the reason Erskine Bowles and Al Simpson called for additional reforms in the Bipartisan Path Forward.
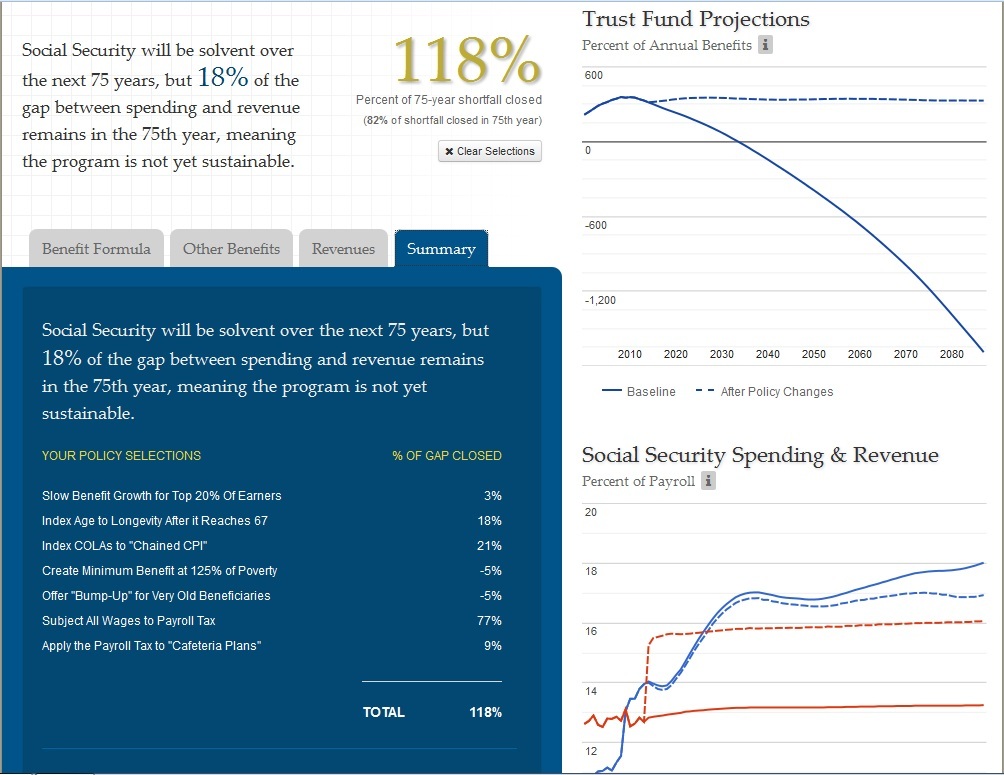
Second is the Domenici-Rivlin plan. That plan slows growth of initial benefits for the top 20 percent of beneficiaries, switches to the chained CPI, adjusts the benefit formula for life expectancy (proxied by ndexing the retirement age for life expectancy), includes state and local workers in the system, creates a minimum benefit, raises the payroll tax cap to cover 90 percent of earnings, and apply the payroll tax to employer-paid health insurance premiums. The last policy is not part of the calculator but is simulated by taxing cafeteria plans and completely eliminating the taxable maximum. Our calculator shows that this approximation of Domenici-Rivlin would more than close the 75-year shortfall and reduce the 75th-year deficit by 82 percent. In 2050, the plan would reduce scheduled benefits by 1 percent, increase payable benefits by 26 percent, and increase taxes by 20 percent.
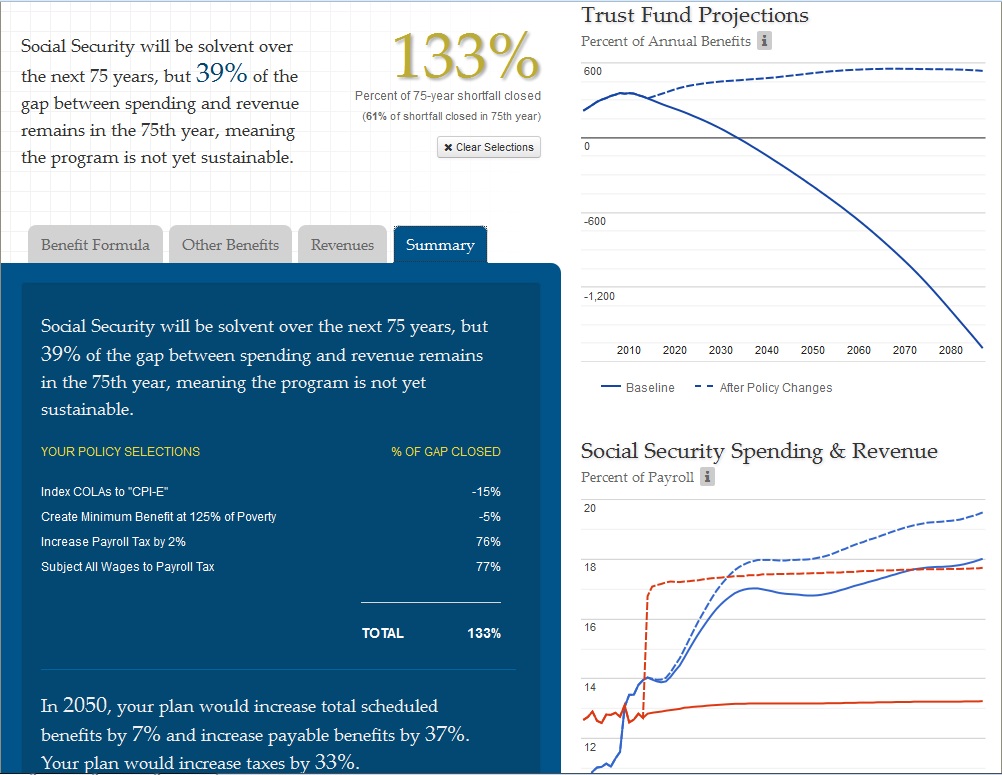
Next up is a plan mentioned by Virginia Reno of the National Academy on Social Insurance (NASI) at our event yesterday. It is a plan based on a survey of average Americans where they were given 12 different options for reforming Social Security. They chose the following: eliminate the payroll tax cap, raise the payroll tax rate by two percentage points, switch to the CPI-E for cost-of-living adjustments, and enact a minimum benefit. This plan more than closes the 75-year shortfall while increasing scheduled benfits in 2050 by 7 percent, payable benefits by 37 percent, and revenue by one-third. However, the plan closes only about 60 percent of the 75th year deficit.
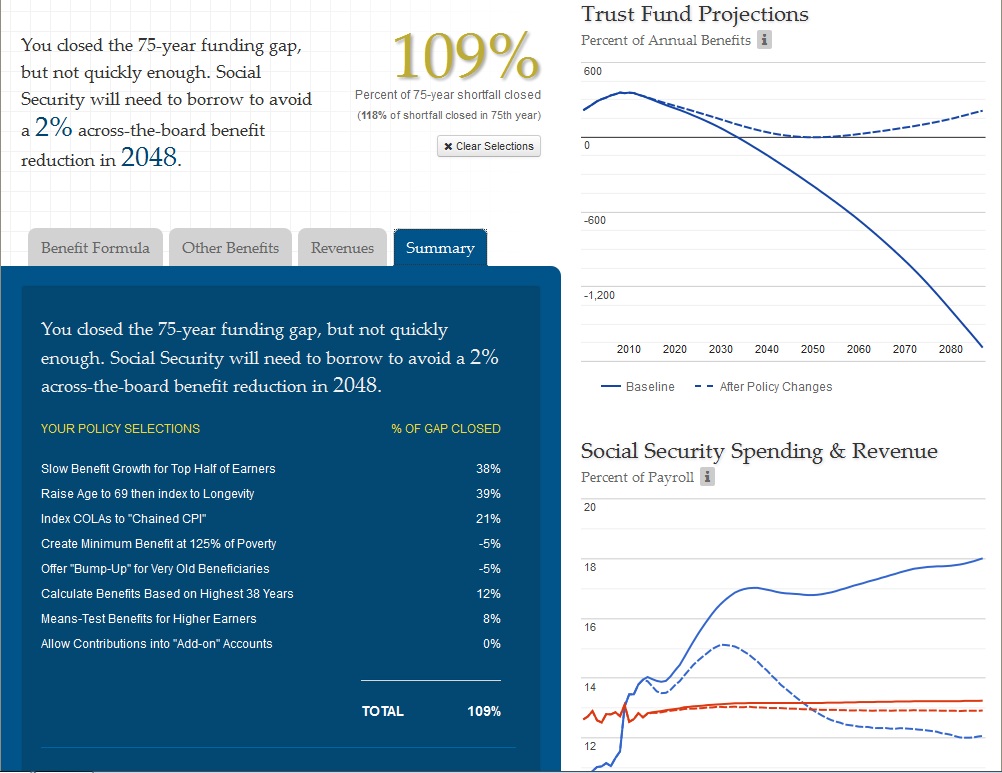
Next, we'll look at a proposal by Rep. Jason Chaffetz (R-UT) that was evaluated by the Social Security Administration in November 2011. The proposal raises the normal retirement age to 69 and indexes it for life expetancy, reduces initial benefit growth for the top half of earners, switches to the chained CPI, means-tests benefits for high earners, creates a minimum benefit and old-age bump up, increases the computation period for calculating benefits, and has add-on accounts. His plan would close the 75-year and 75th year shortfall, meaning it would achieve sustainable solvency except that in our model the trust fund briefly turns negative in 2048. However, because the means-testing proposed by Rep. Chaffetz is more ambitious that what is in our model, it likely would avoid insolvency altogether. In 2050, the Chaffetz plan would reduce scheduled benefits by 23 percent, payable benefits by 2 percent, and revenue by 2 percent. Some of the loss in benefits would likely be made up for by additional retirement income from add-on accounts.
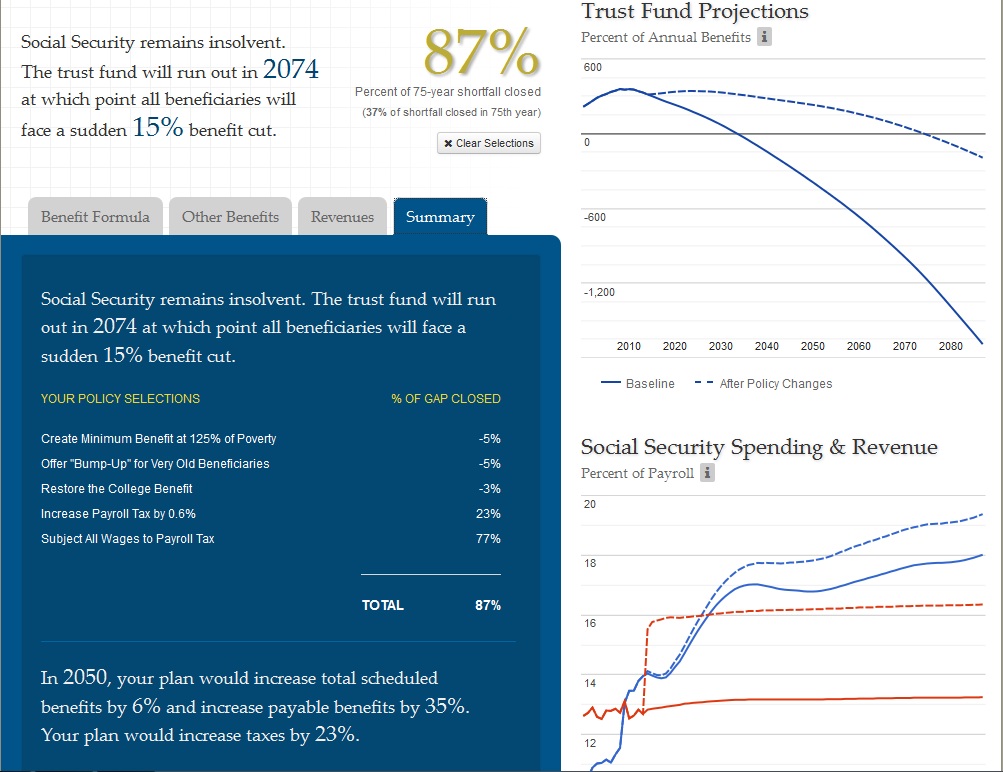
Finally, there is a proposal from Rep. Gwen Moore (D-WI), evaluated by the SSA in March of this year. The plan increases the payroll tax rate by 0.6 percentage points, eliminates the payroll tax cap, and enacts the three benefit enhancements in the calculator (minimum benefit, old-age bump up, and college benefit). Those policies would extend the life of the trust fund for about 40 years to 2074, closing 87 percent of the 75-year shortfall and 37 percent of the 75th year deficit. It would increase scheduled benefits by 6 percent, payable benefits by 35 percent, and taxes by 23 percent in 2050.
So how does the reformer compare to the modeling of the Chief Actuary? It's hard to know for sure, since the policies we modeled were often slightly different than what was in the plans and the solvency gap now is larger than when some of the plans were originally scored (this is especially true for Simpson-Bowles and Domenici-Rivlin). But it looks like it stacks up well.
| Comparing The Reformer and SSA Estimates (Percent of 75-Year Shortfall Closed) | ||
| Reformer | SSA | |
| Simpson-Bowles | 102% | 112% |
| Domenici-Rivlin | 118% | 129% |
| NASI | 133% | N/A |
| Chaffetz | 109% | 109% |
| Moore | 87% | 84% |
Source: SSA, CRFB
These are a just few examples of Social Security reform plans evaluated through The Reformer. As you can see, there are many ways to achieve solvency, or at least come close, with plans relying heavily on the benefit side, revenue side, or a combination of the two. Feel free to create your own plan to shore up Social Security's finances for future generations!

