Five Years Since Simpson-Bowles: How Much of It Have We Enacted?
Today marks the fifth anniversary of the National Commission on Fiscal Responsibility and Reform's (Fiscal Commission's) vote on the Simpson-Bowles plan, in which 11 out of 18 commissioners voted to support an ambitious plan to reduce 10-year deficits by $4 trillion (relative to a "current policy" baseline) by addressing virtually all areas of the budget and tax code.
Despite several rounds of negotiations in 2011 and 2012, Congress and the President unfortunately never agreed to a "grand bargain" of the scale or scope proposed by the majority of the Fiscal Commission. Yet substantial deficit reduction has been enacted through a piecewise approach; by our estimate, those measures (excluding legislation which has increased deficits) have totaled to over three-fifths of the deficit reduction the Simpson-Bowles report called for between 2012 and 2020. Unfortunately, these savings have come largely from near-term cuts in discretionary spending and not from gradual pro-growth tax and entitlement reform which the Fiscal Commission proposed in order to achieve long-term sustainability while promoting short- and long-term economic growth.
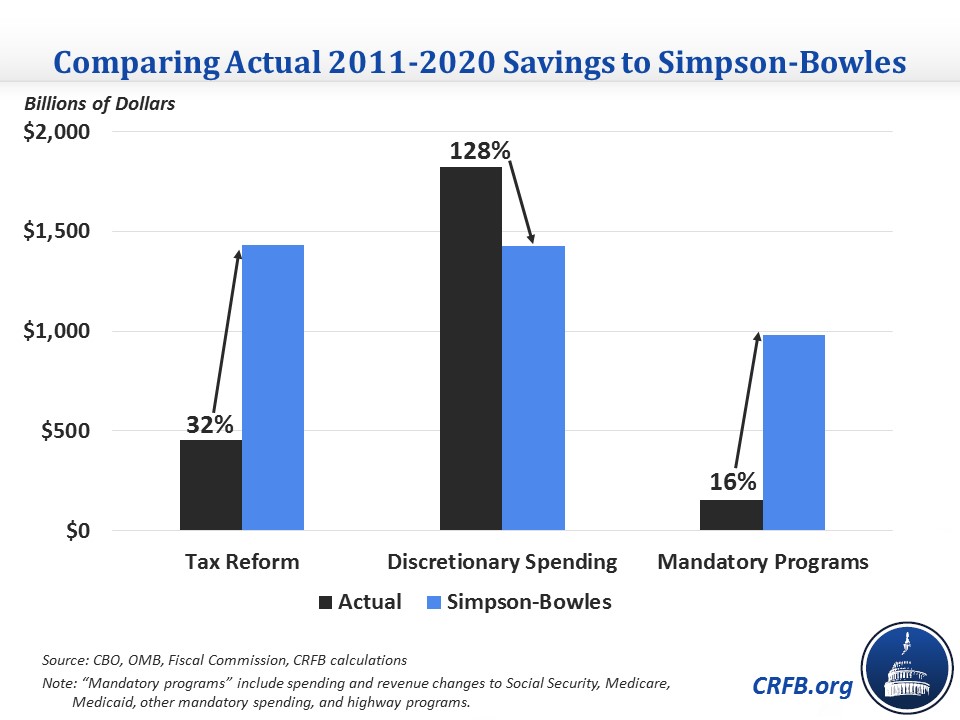
Indeed, according to our estimates, lawmakers have enacted nearly 130 percent of the defense and nondefense discretionary cuts proposed by the Fiscal Commission through 2020. Yet they have generated less than one-third of the revenue and done so entirely through higher rates rather than pro-growth tax reform. And they have enacted only one-sixth of the savings to mandatory programs, which represented a small share of the Fiscal Commission's savings through 2020 but grew over time and was the key to long-term fiscal sustainability. (See our methodology below for more information about the calculations.)
In other words, lawmakers have largely failed to address the nation's most pressing fiscal challenge: the large and growing cost of Social Security, Medicare, and Medicaid.

And while the enacted deficit reduction has improved the nation's fiscal outlook somewhat, it cut much sooner than when the Fiscal Commission – which put forward the principle of "don't disrupt the fragile recovery" – recommended. Enacted deficit reduction likely reduced the country’s overall risk of fiscal crisis in the near term, but the Congressional Budget Office and others warn that risk will rise as debt continues to grow rapidly over the long term.
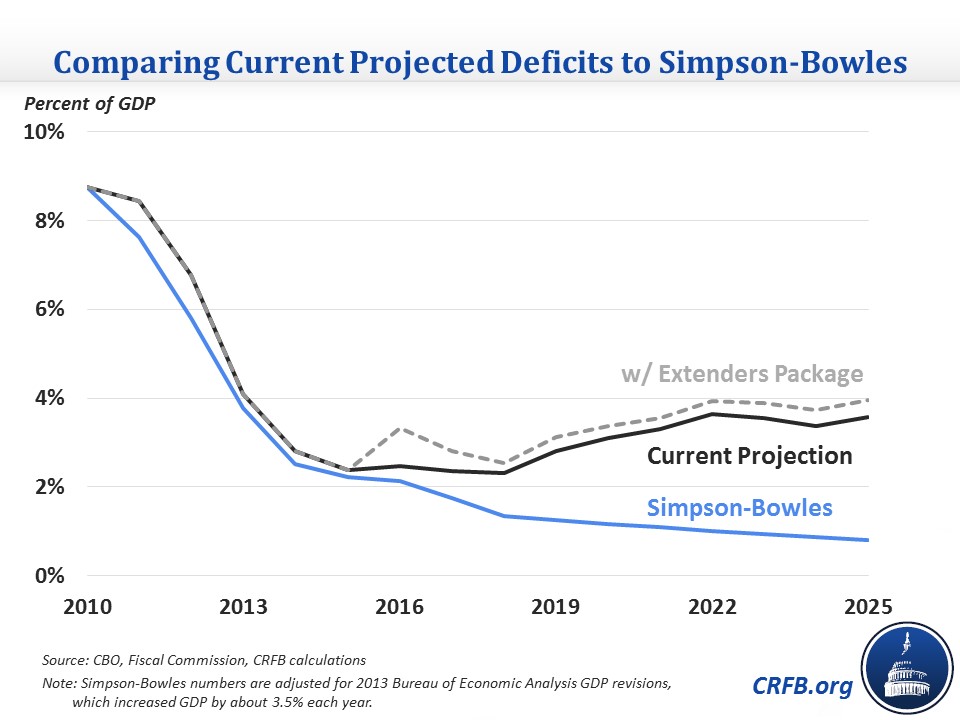
The front-loaded nature of actual deficit reduction can also been seen by looking at actual deficit levels – though they have been influenced as much by changes in projections as legislation. Today's deficits as a share of Gross Domestic Product (GDP) are almost identical to the levels proposed by the Fiscal Commission, and indeed current law has tracked Simpson-Bowles relatively well since 2010. But after 2016, current law deficits are slated to rise – whereas under the Simpson-Bowles plan they would fall. In 2025, deficits were projected to total only 0.8 percent of GDP under Simpson-Bowles, but would reach 3.6 percent of GDP under current law, or 4 percent of GDP if the tax extenders package under discussion passes.

This divergence is similarly evident when looking at debt, though due to poorer economic performance and more near-term tax cuts debt is already significantly higher than what Simpson-Bowles proposed. Under Simpson-Bowles, debt was projected to peak below 70 percent of GDP in 2013, fall to 65 percent of GDP by 2020, and further fall to 55 percent of GDP by 2025. By contrast, debt is currently about 74 percent of GDP and is projected to rise to 77 percent of GDP by 2025 – or 80 percent if the extenders package passes. This is despite the fact that the budget has seen favorable economic and technical revisions to budget projections, such as lower interest rates and slower health care spending growth. In short, our current path has debt both higher than Simpson-Bowles and going in the wrong direction.

These numbers reflect what we have often said about the deficit reduction that has taken place: lawmakers have focused too much attention on discretionary spending relative to other parts of the budget. While some revenue has been raised, few tax expenditures have been addressed and tax reform has proven elusive. Perhaps more troubling, practically nothing has been done to reform Social Security, and significantly more must be done to slow the growth of federal health spending.
The Fiscal Commission doesn't represent the only way to put the debt and economy on a sustainable path, but it did show the key areas that must be addressed. Despite progress in reducing the deficit, lawmakers still have much to do to secure the nation's fiscal future.
Methodology for Calculating Savings
Our calculations are very rough and based on a number of assumptions and decisions. We compare actual legislation to Simpson-Bowles using the original 2011-2020 budget window and using a baseline that assumes that discretionary spending grew with inflation from 2010 levels, the 2001/2003 income tax cuts were extended permanently, doc fixes were enacted at just above a freeze, and war spending was drawn down based on the path that has actually occurred (the Fiscal Commission baseline assumed discretionary spending grew at the rate in the President's budget, and that the 2001/2003 tax cuts were extended for incomes below $200,000/$250,000, that doc fixes continued at a freeze, and that war spending drew down based on a CBO-provided illustrative path).
We generally relied on original scores of Simpson-Bowles policies, though we made an exception in the case of the CLASS Act repeal given that the CLASS Act never went into effect. We calculated Simpson-Bowles revenue levels based on the tax reform targets they proposed plus any additional income tax revenue that would have been raised from allowing the upper-income tax cuts to expire based on our understanding that the Fiscal Commission was intentionally silent on estate tax policy.
Using this new baseline, we estimated that the Simpson-Bowles plan saved $3.8 trillion through 2020, excluding interest savings. Using the same baseline and counting all major deficit reduction legislation but excluding deficit-increasing legislation, we calculated actual enacted savings of $2.4 trillion over the same time period. This includes $1.8 trillion of discretionary savings (compared to the $1.4 trillion in Simpson-Bowles), $450 billion of revenue (compared to more than $1.4 trillion in Simpson-Bowles), and $150 billion of mandatory spending cuts (compared to about $1 trillion in Simpson-Bowles). Note that none of these numbers include the cost of legislation that has added to the debt, nor various economic and technical changes.


