Dissecting the Good Health Care Spending News in CBO's Long-Term Outlook
The Congressional Budget Office’s (CBO) new Long-Term Budget Outlook presents plenty of good news on Medicare costs yet still highlights the role that increased federal health care spending plays in driving the medium- and long-run growth in our debt. While costs are lower than in last year's projection, health care spending is still expected to increase significantly as a percent of GDP over the long term.
Projected federal health care costs overall may be down only a small amount (0.1 percent of GDP annually) since last year's report, but they have now been lowered by an astounding $900 billion cumulatively from 2011-2021. Moreover, CBO also slightly lowered its estimate of underlying health care cost growth because it is based on the historical average of spending growth since 1985 (with recent years weighted more heavily), which now incorporates one more year (2012) of very slow growth. For Medicare, this works out to slower long-term spending per beneficiary growth of about 0.07 percentage points annually.
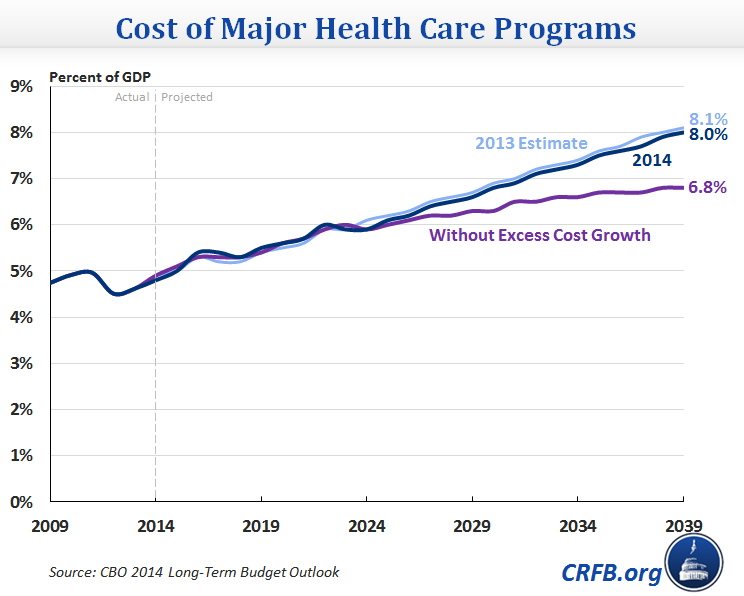
Despite the improvements, spending on these programs is still scheduled to grow from 4.8 percent of GDP this year all the way up to 8 percent of GDP by 2039.
But what happens if the recent health care slowdown turns out to be largely structural and persists? CBO tells us that if the increase in health care spending per beneficiary is held to the growth in the economy (no excess cost growth), federal health spending will still reach 6.8 percent of GDP within 25 years as a result of an aging population and coverage expansions underway. While a 2 percent GDP increase in the federal government’s commitment to health care over 25 years is still substantial, a 1.2 percentage point reduction in health care spending’s share of GDP in 2039 would be a significant achievement.
Notably, CBO cites evidence “that hospitals and other providers may be able to achieve significant productivity gains or to restrain the growth of their costs in some other way,” which is part of the reason its more pessimistic Alternative Fiscal Scenario no longer assumes that the Affordable Care Act (ACA)-mandated productivity adjustments (cuts) to payments for non-physician providers will cease to be achievable after the first decade. In fact, CBO cites data from the Medicare actuaries and the American Hospital Association indicating that both Medicare and private sector payment updates for non-physician health care providers grew only with economywide inflation from 1991-2011, while hospital profit margins actually increased (from “between 4 and 5 percent” in the early 1990s to “about 7 percent” in 2011).
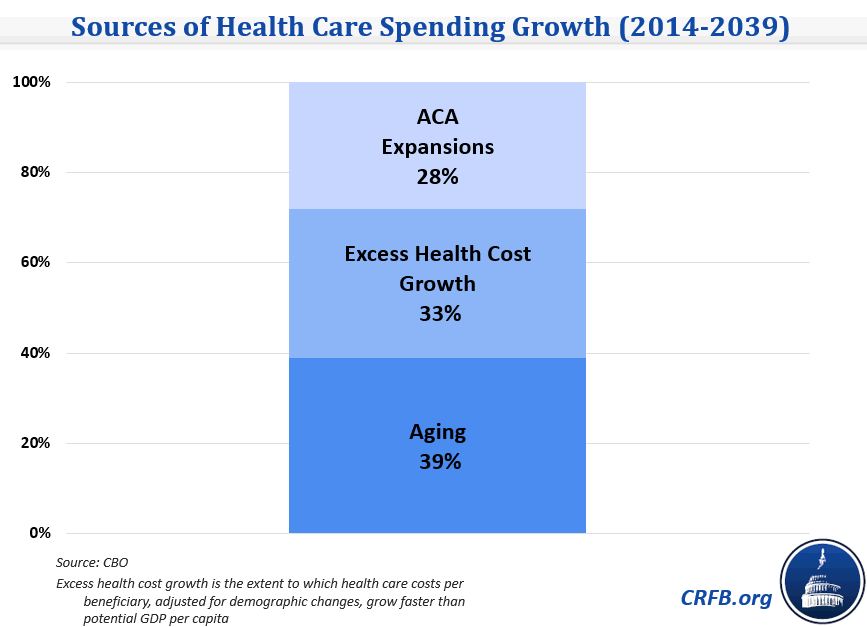
The remaining projected growth of federal health care spending is driven by the aging of the population and the ACA’s coverage expansions. In total, these two factors are responsible for two-thirds of projected spending growth through 2039, with the last third attributable to excess health care cost growth.
While overall federal health costs were revised slightly downward since last year, the news in Medicare was even better (conversely, medium-term Medicaid growth was actually revised upward due to methodological changes). Net Medicare spending from 2014-2023 was revised down by $229 billion, and spending in 2039 is now projected to be 0.3 percent of GDP lower than last year.
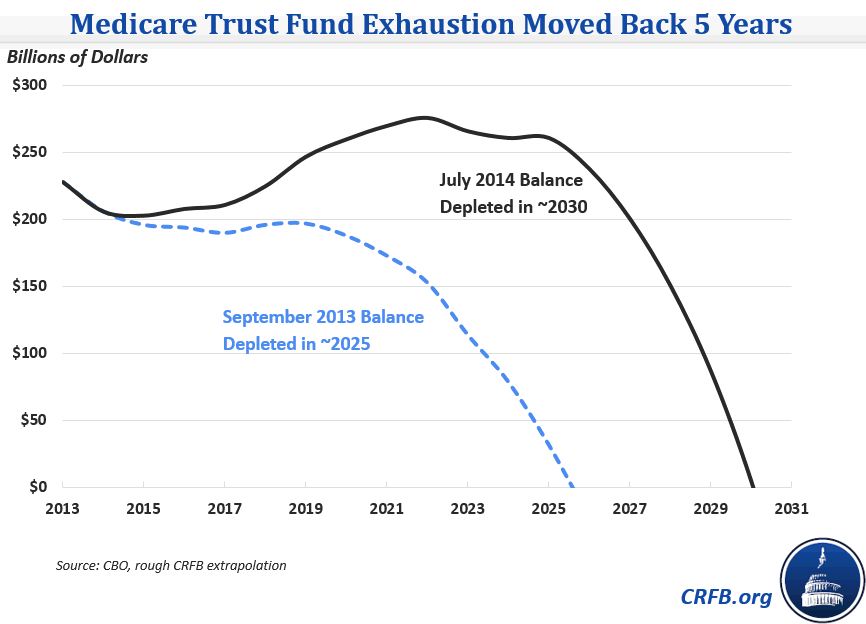
And because much of this revision affected Part A (hospital insurance) – largely because of increases in projected productivity growth and decreases in projected inflation growth, both of which hold down non-physician provider payment updates – the Medicare Hospital Insurance Trust Fund is now expected to last 5 more years before exhaustion, until about 2030. This is the first major change in the esimate of the HI Trust Fund's exhaustion date since the ACA was passed, largely because most of the remaining Medicare slowdown in the preceding years occurred in Part D of the program, and revenue had come in lower to offset the slowdown that did occur.
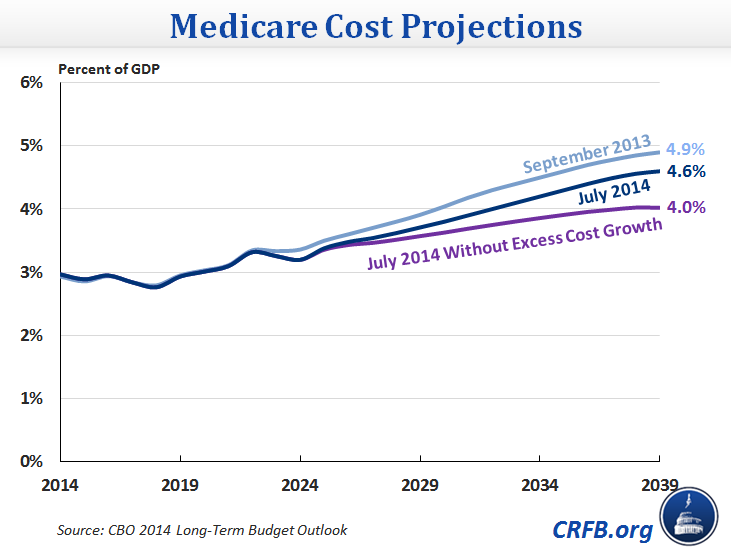
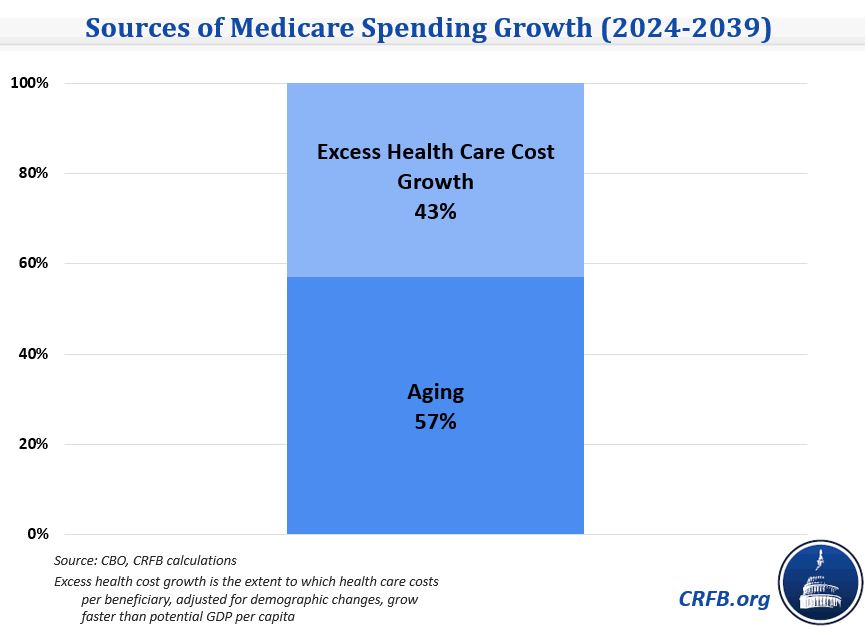
The above Medicare spending graph also illustrates that if the Medicare slowdown persists and no excess cost growth occurs from 2024-2039, spending will rise from roughly 3 percent of GDP today to only 3.2 percent in 2024 and 4 percent by 2039. Therefore, as the baby boom generation moves into its later years (from 2024-2039), aging is now expected to be responsible for 57 percent of Medicare spending growth versus the 43 percent attributable to excess cost growth.
CBO’s updated projections are an important reminder that controlling health care cost growth over the long term remains arguably the most critical challenge facing the federal budget. While the recent slowdown is encouraging, more must be done to change the spending trajectory over the long term. Reforms will likely need to be made to the way we deliver and pay for care and to ensure that the promising changes already underway in our health care system are fostered. Fortunately, as a paper last year from the Moment of Truth Project shows, a consensus appears to be building on the types of reforms that can help bend the health care cost curve while also improving the patient experience.


