CBO Report Shows Infrastructure is More Pro-Growth When It's Paid For
The Congressional Budget Office (CBO) released a report today detailing the macroeconomic effects of two illustrative, $500 billion infrastructure packages. According to CBO, a deficit-neutral package would not only be better for the budget than a deficit-increasing one, but would also provide a larger economic boost. Based on these findings, we expect the bipartisan Infrastructure Investment and Jobs Act would boost annual economic output by 0.05 to 0.1 percent above current law and generate only negligible fiscal feedback over the next 30 years.
Paid-For Infrastructure is Better for the Budget and Economy
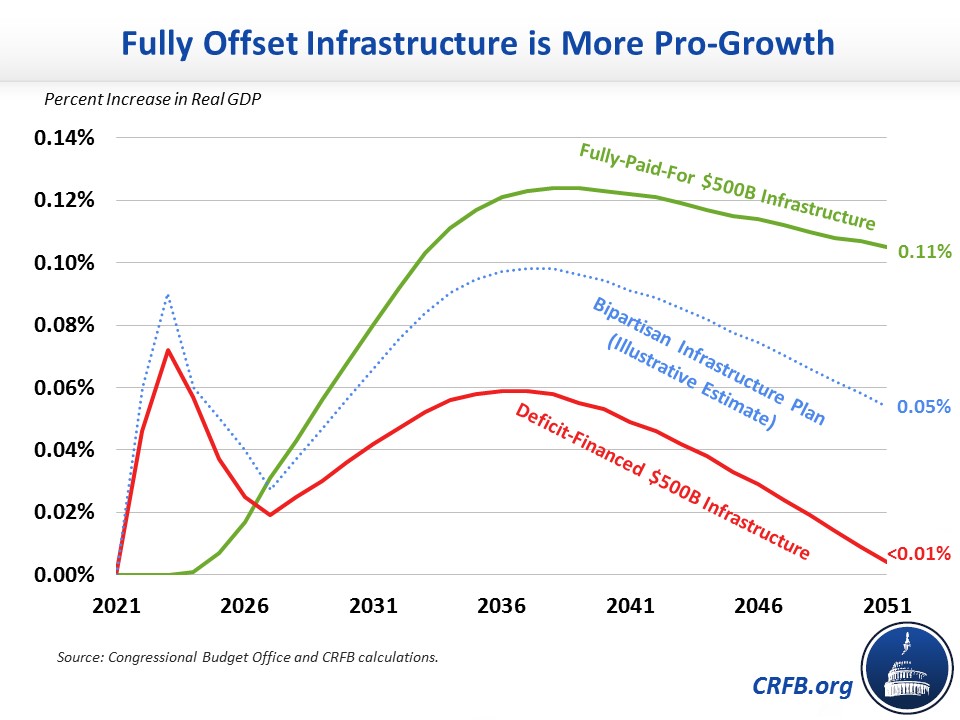
In its report, CBO evaluated the effects of two different, illustrative plans to authorize $500 billion of infrastructure spending – one fully offset and the other financed with higher deficits. While CBO estimates both packages would boost economic output, the fully-paid-for plan would generate a higher and more sustained boost relative to the deficit-financed plan. By 2041, CBO estimates its illustrative infrastructure package would boost real Gross Domestic Product (GDP) by 0.12 percent if fully offset and by 0.09 percent if deficit financed. By 2051 – 30 years after enactment – CBO estimates its illustrative package would boost GDP by 0.11 percent if fully offset, but by only a negligible amount if deficit financed. Beyond 2051, it appears a deficit-financed infrastructure plan would actually shrink annual output.

As we've explained before, deficit-financed investments do less to increase output because increases in public investment are offset by reductions in private investment.
In terms of dynamic feedback, CBO estimates the fully-paid-for package would generate enough economic growth to offset 3 percent of its costs (based on gross costs) over a decade and a third of its costs, on a present-value basis, over three decades. On the other hand, a deficit-financed package would pay for less than 1 percent of its costs over a decade through economic growth and would actually cost 25 percent more over 30 years as a result. This higher cost is driven by a combination of higher interest rates and higher price levels, which more than offset the modest boost in GDP.
Dynamically Scoring the Bipartisan Infrastructure Investment and Jobs Act
CBO's report estimates the effects of a generic package of infrastructure spending, which differs both in timing and composition from the bipartisan Infrastructure Investment and Jobs Act currently being considered in the Senate. Therefore, one cannot generate a true dynamic score of the bipartisan infrastructure package based on this report. However, the report does provide rules of thumb to allow for construction of a rough analysis.
In total, the bipartisan infrastructure package authorizes nearly $570 billion of infrastructure spending and tax breaks, of which we estimate nearly $250 billion would be paid for over 30 years (over ten years, the package spends $517 billion, of which $170 billion is offset).1
If this spending had a similar path and composition to CBO's illustrative plan, it would increase real GDP by roughly 0.07 percent in 2031, 0.09 percent in 2041, and 0.05 percent in 2051. On average, it would increase real GDP by 0.05 percent over ten years and 0.07 percent over 30 years.
While this higher growth would generate more revenue, it would also increase federal spending on interest and other programs. Overall, we estimate the economic effects of the package would generate roughly $10 billion of savings over a decade. In other words, the $517 billion of spending would be 2 percent self-financing, and the dynamic score would be about $10 billion less than the $343 billion conventional cost. Over thirty years, we estimate no dynamic feedback – higher revenue would be almost exactly countered by higher spending.
Budgetary and Economic Effects of the Bipartisan Infrastructure Investment and Jobs Act
| Measure | Ten-Year Effect | 30-Year Effect |
|---|---|---|
| Real GDP | +0.05% | +0.07% |
| Real GDP (End of Period) | +0.07% | +0.05% |
| Conventional Deficit Effect | $343 billion | N/A |
| Dynamic Effects* | -$10 billion* | $0 billion* |
| Total Deficit Effect, with Dynamic Feedback | $333 billion | N/A |
| Dynamic Feedback as Share of Gross Costs | 2% | 0% |
Source: Congressional Budget Office, CRFB calculations
* Rounded to the nearest $5 billion
If the plan were fully paid for, the outcome would be much better. We estimate a fully-paid-for version of the plan would boost GDP by 0.12 percent by 2051 and generate nearly $190 billion of dynamic feedback over 30 years – enough to cover one-third of the gross costs of the bill.
Importantly, the actual dynamic effects of the plan could differ. Relative to CBO's illustrative plan, the bipartisan infrastructure package invests and borrows more quickly, and its mix of investments differs. Our analysis also excludes the impact of the plan on the Highway Trust Fund baseline, which would result in more investment and borrowing and likely worsen the economic impact.
While CBO's report does not allow for a conclusive assessment of the economic effects of the bipartisan infrastructure package, it makes clear that dynamic feedback will be relatively modest and that the plan would be much more pro-growth if it were fully offset.
1 This estimate uses a discount rate for offsets in future decades.

