Supplemental Payments Drive Up Federal Medicaid Costs
States often make lump-sum supplemental payments to health care providers that are not linked to or based on the provision of specific Medicaid services. These payments are in addition to states’ base Medicaid payments, which are made to either health care providers on a fee-for-service (FFS) basis or managed care organizations on a per-person capitated basis.
Supplemental payments originated to ensure hospitals and other providers received adequate funding to continue serving Medicaid patients. However, the payments have grown dramatically and make it easier for states to rely on provider taxes and other financing gimmicks to inflate total Medicaid costs and shift those costs onto the federal government.
Historically, supplemental payments were associated with services provided under the FFS delivery and payment model, but with states increasingly turning toward Medicaid managed care arrangements, a new type of supplemental payment has arisen called state directed payments.
State directed payments are subject to fewer rules and limits than traditional supplemental payments. They are now the largest type of supplemental payment. Without reform, this could lead to even more inventive state financing gimmicks and increased federal Medicaid spending.
In this paper, we explain:
- Supplemental payments facilitate increased federal Medicaid spending – often without increased care or coverage – under both FFS and managed care.
- There are several types of supplemental payments, with varying limits on use.
- State financing schemes use supplemental payments to exploit federal rules.
- There are several options for addressing these issues.
Policymakers should work to rein in excessive federal Medicaid spending where it is not resulting in broader or better health care coverage. In previous briefs, we discussed the benefits of limiting provider taxes and other financing gimmicks. Policy reforms could seek new limits on all forms of supplemental payments as well as the broader array of state financing schemes.
State Methods to Deliver and Pay for Medicaid Services
State Medicaid programs generally deliver and pay for medical services under one of two models: FFS and managed care.
Under a FFS delivery model, states set provider payment rates and make those payments directly for services provided. The federal government reimburses states for their share of spending based on these payments. Under a managed care delivery model, states contract with private managed care organizations (MCOs) that enroll Medicaid beneficiaries in health plans and pay the MCOs a fixed capitation payment for each beneficiary enrolled in their health plan. In return, each MCO is responsible for arranging and paying providers’ claims for all covered services provided to Medicaid beneficiaries. The federal government reimburses states their share of spending based on the capitation payments they make to MCOs.
Most states use a mix of FFS and managed care. However, there has been an increasing shift toward managed care arrangements, with payments to MCOs representing over half of all Medicaid spending (up from 15 percent in 1999) and with nearly three-quarters of all Medicaid beneficiaries enrolled in comprehensive MCOs.1
Both state FFS payments and MCO payments to providers for Medicaid services are referred to as base payments. States can then add supplemental payments – lump-sum payments to hospitals and other providers that do not depend on specific health interventions. In 2022, these payments cost at least $95 billion, on top of FFS base payments of $319 billion and capitation base payments of $406 billion.
The supplemental payment arrangements are at the center of many financing schemes used by states to increase federal Medicaid funding. Because supplemental payments are not directly tied to specific health care services, states are able to more easily use financing gimmicks (like provider taxes) to increase provider payments without having to carefully balance payment rates to satisfy regulations around those schemes, and without necessarily increasing services or improving performance quality metrics.2
This allows state schemes to promote excessively large Medicaid supplemental payments that exceed providers’ total costs of providing Medicaid services. In 2012, for example, the U.S. Government Accountability Office (GAO) found that regular Medicaid and supplemental payments made to 505 hospitals in 39 states resulted in total payments exceeding Medicaid costs by $2.7 billion.3 Supplemental payments have only grown since then. Both the GAO and Medicaid and CHIP Payment Access Commission (MACPAC) recognize that states often determine supplemental payments based on the ability of providers and local governments to fund the payment rather than on the volume of Medicaid services hospitals provide.4
Types of Supplemental Payments and Their Limits
Supplemental payments originated when most states relied primarily on FFS, and they took the form of federally required disproportionate share hospital (DSH) payments – intended to offset uncompensated care. States are also permitted to make other non-DSH supplemental payments in their FFS arrangements and have increasingly done so over the years. New types of supplemental payments have since cropped up in managed care arrangements.
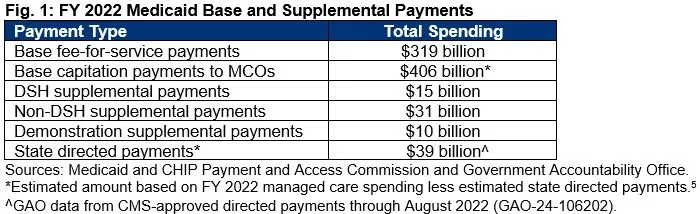
DSH payments are made by states, as required by federal law, to hospitals that serve high volumes of Medicaid beneficiaries and low-income, uninsured individuals. The idea was to give additional funds to compensate for the adverse financial impact of providing large amounts of uncompensated care to uninsured or underinsured patients. These payments fall under a total national cap, a state-by-state cap, and a hospital-specific cap. The Affordable Care Act provided for a phasedown of DSH, although Congress has continually averted those cuts. In FY 2022, DSH payments totaled $15 billion.6
Non-DSH supplemental payments are payments states began making after limits were placed on DSH payments; however, unlike DSH payments, they are not required by federal law and lack a specific statutory or regulatory origin.7 FFS base payments and supplemental payments are required to be economical and efficient, and for hospitals they are subject to upper payment limits (UPLs) based on Medicare payment levels. UPLs are the maximum amount states can pay providers and receive federal matching funds. The limits are not imposed on a provider-by-provider basis; rather, they are applied in the aggregate for different categories of medical services and provider ownership types. In FY 2022, non-DSH supplemental payments totaled $31 billion.8
With the proliferation of managed care from FFS, states have pursued different approaches to continuing lump-sum payments despite long-standing federal rules technically prohibiting supplemental payments for managed care. The law requires state capitation payments, by themselves, to be actuarially sound – meaning that payments should be sufficient to cover the reasonable and appropriate costs of services for Medicaid beneficiaries enrolled by a plan and high enough that providers are willing to treat such beneficiaries.
As states began transitioning to managed care, they faced ending or reducing the size of their FFS supplemental payments. In response, they developed – and the Centers for Medicare and Medicaid Services (CMS) allowed – ways of continuing supplemental payments without ensuring payments are used for the needs of specific providers and Medicaid services and without UPLs.9 These new types of payments include:
- Demonstration Supplemental Payments – Some states receive waiver approvals from CMS to establish and make supplemental payments in their Medicaid programs, including payments made from large funding pools created by provider taxes and local government funds.10 In FY 2022, demonstration supplemental payments totaled $10 billion.11
- Pass-Through Payments – As states moved away from FFS to managed care, they started making additional, pass-through payments to providers by increasing capitation rates paid to MCOs and then requiring MCOs to direct the additional funds to certain providers.12 These “add-ons” to the base capitation rate in their MCO contracts allowed states to maintain consistent payments for hospitals, nursing homes, and other providers. They also allowed states to avoid disruption of the existing provider taxes and intergovernmental transfer (IGT) mechanisms associated with FFS supplemental payments.13 In 2016, CMS issued a Final Rule implementing a ten-year phaseout of pass-through payments because they were inconsistent with the requirement that managed care rates be actuarially sound.14
- State Directed Payments – As part of the same 2016 Final Rule, however, CMS established state directed payments as a new option for states to direct payments to providers on top of managed care arrangements but not built into MCO contracts. CMS attempted to impose restrictions on their use, requiring that they (1) be based on actual services delivered under the MCO contract, (2) be distributed equally among provider classes, (3) advance at least one goal in the state’s managed care quality strategy, and (4) not be contingent on provider participation in IGTs. State directed payments totaled an estimated $39 billion in 2022.15
State directed payments now constitute the largest type of supplemental payment, growing quickly and substantially from an estimated $26 billion a year as of December 2020 to over $69 billion a year as of February 2023.16 In some ways, their existence highlights CMS’s acquiescence to states’ bad faith use of pass-throughs and continued shifting of money through these new, but very similar, payments. It is abundantly clear that the regulations attached to state directed payments have not effectively curbed the growth in their use by states for purposes of increasing the federal share of spending.
While non-DSH supplemental payments (under FFS) are limited to raising Medicaid provider payments up to Medicare levels, CMS has approved state directed payments arrangements that permit reimbursements to providers up to the average commercial rate negotiated with private payers, surpassing Medicare reimbursement levels. Certain contracts even offer providers nearly triple the Medicare rate for hospital inpatient and outpatient services.17
State Maximization Schemes Exploit Broad Federal Financing and Payment Rules
As we have shown before, state financing schemes boost the federal government’s share of Medicaid costs above what would occur under the statutory federal matching rate (FMAP) – a so-called “real FMAP” that GAO and MACPAC estimate is about 5 percentage points higher.
Disaggregating the types of state Medicaid payments reveals that the federally matched amount – the percentage of total Medicaid payments covered by the federal government – is even higher for supplemental payments, particularly those involving provider taxes and intergovernmental transfers. That’s because those financing methods, when combined with the lump-sum payments, allow a state to easily: 1) generate high supplemental payments to providers, 2) receive federal matching funds on those higher payments, and then 3) have the providers return some of the extra money to the state government, which 4) leads to a higher federal percentage of the actual payment (net of the returned money) than the statutory FMAP rate.
In its analysis of 2018 state spending (Fig. 2), GAO found that the overall federal matching rates increased by 12 percentage points for DSH payments and 9 percentage points for non-DSH supplemental payments because state reliance on provider taxes and local funds was greater for these payments.
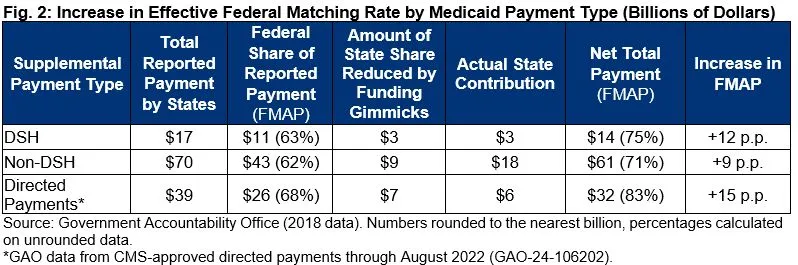
Federal matching rate increases were even greater than these averages in over one-third of states. Specifically, 19 states had increased matching rates of over 15 percentage points for DSH and non-DSH payments.18 Further, GAO found that 13 states made over $11 billion in non-DSH supplemental payments, and 11 states made over $2.8 billion in DSH payments, generating over $8.3 billion in federal matching funds without expending any of their state general funds.19
Directed payments tied to MCOs were not included in the 2018 data and exact numbers are more difficult to discern given the lack of transparency over these types of payments. However, based on one GAO report estimating (partial) 2022 state spending, there was an increase of 15 percentage points in the effective FMAP for net directed payments, and 40 percent of those state direct payments were financed with no contributions from state general funds.20
It is worth pointing out that this isn’t just an accounting concern – quibbling with some extra money being put to direct use for Medicaid beneficiaries. Rather, these federal funds are not necessarily being used appropriately for Medicaid covered services as intended under their enabling law. This is especially true when provider payments exceed actual Medicaid costs and surplus funds are used to offset costs for general hospital operations, maintenance, construction of new clinics, and capital purchases – in one case, including a helicopter.21
Policymakers Should Tighten Financing and Payment Rules, Strengthen Oversight
The broad federal regulations governing state financing of Medicaid costs and payments have not been effective at limiting states from establishing financing and payment schemes. Similarly, regulations on different types of supplemental payments have also been worked around. As one example, the UPLs on non-DSH supplemental payments in FFS are not applicable to state directed supplemental payments. Restrictions in this arena wind up resembling “whack-a-mole” where financing schemes and supplemental payments allow states to remain one step ahead and substantially increase federal funding with little to no financial impact to state general funds.
The best path forward is to rework the broad rules that incentivize states to continue on this path. While the largest source of state funding for total Medicaid spending is state general funds, federal law permits state general funds to represent less than half of total state spending. Specifically, under federal requirements, state general funds must represent at least 40 percent of state Medicaid payments, and funds derived from local governments can represent up to 60 percent of state Medicaid payments.22
One of the flaws in the current 40 percent state general funding requirement applies to each state’s total Medicaid program spending. That means the requirement is relatively easy to get around since base payments through FFS or MCOs are still substantially higher than supplemental payments, so states can easily finance the entirety of their share of supplemental payments without using general funds, and those payments have room to keep expanding.23 Making matters worse is that provider taxes are currently considered part of state general funds.
Policymakers could look at a new comprehensive policy requiring each state to contribute a minimum amount of state general funds for all types of payments, measured discretely – i.e. base payments are subject to the minimum, as are each type of supplemental payment. Provider taxes should also be pulled out of any calculation of state general funds when measuring up against the 40 percent limit.
Here is a sample package of such a payment-specific policy that would directly address financial incentives that have driven the growth in supplemental payment spending:
- State general funds must account for at least 40 percent of the state’s share of each Medicaid payment type.24
- Local government funds may fund up to 60 percent of the state share of each payment type.
- Provider taxes, considered as a completely separate source of funds, must total less than 10 percent of total state Medicaid spending.
Using underlying data from GAO’s 2018 report, shared with the Committee for a Responsible Federal Budget at the urging of Congress, we estimate that implementing this illustrative package of funding limits would save well over $440 billion in federal funding from 2024-2033.25
Our estimate assumes 2018 practices carried forward. However, this estimate is quite conservative in that it doesn’t assume any growth in the use of state financing gimmicks. Also, because it’s based on the supplemental payment breakdown from 2018, it does not include the large state directed payments tied to MCOs or their potential growth in use.
Even with this more comprehensive and restrictive policy, we estimate that total effective FMAP across the country, which GAO and MACPAC put at 5 percentage points higher than the statutory FMAP due to all state financing schemes, would still be 4 percentage points higher. This suggests substantial further room to cut back at these practices over time. However, the illustrative package would also be effective at reducing the amount of supplemental payments and limiting the growth in state financing schemes going forward.
Absent broadly enforced overall funding limits, another option would be to continue the piecemeal approach of enacting new rules that curtail states’ use of various supplemental payments – with a specific focus on restrictions for state directed payments and tightening upper payment limits. CMS proposed restrictions in May 2023, but has not finalized the rule.26 Payment limits for non-DSH supplemental payments could also be strengthened by replacing aggregate limits with provider-specific limits.
Beyond improving financing and payment rules, increased transparency and oversight is necessary to better understand payment schemes, implement new and effective policies, and enforce new policies – especially for state directed payments, where information remains extremely limited.27 Actual state directed payment amounts are not separately reported from normal capitation payments on required quarterly expenditure reports each state is required to submit to CMS because actual spending data is not required for the renewal process, which is primarily prospective.28 Both GAO and MACPAC have recommended steps to change federal policy to better understand the payments and how they are financed.
Finally, as discussed in our earlier briefs, federal limits aimed at provider taxes have not curtailed their increasing use and the ability for states to use provider taxes to establish circular tax and payment arrangements to maximize federal spending. Action on that mechanism, for instance, by reducing the current safe harbor threshold, would also help limit the growth of supplemental payments and would move toward a financing split more consistent with key principles of Medicaid’s federal and state partnership.
Conclusion
The Medicaid program is costly, out of balance, and the federal-state sharing of financing is not working as intended. The evolution, expansion, and growth of distinct types of supplemental payments has led to a substantial increase in overall Medicaid costs not tied to quality or availability of care and has increased the federal share of Medicaid spending well beyond what is intended under the law.
Supplemental payments create the illusion of large Medicaid payments that allow states to draw down billions in federal Medicaid funds. The payments are not based on a specific need or purpose and states are not contributing state general funds. The payments are largely driven by the amount of funding providers and local governments can contribute to finance the payments.
Despite the substantial increase in federal Medicaid funds and the shifting of state costs to the federal government, federal action to close loopholes and rein in state schemes has largely been absent, and ineffective when actually attempted.
Absent federal action, however, states will continue to be driven by the financial gains they reap in federal funding from illusory supplemental payments. These schemes cost the federal government tens of billions of dollars annually and allow states to replace state funding that would otherwise be needed with federal Medicaid funds.
Needed changes involve commonsense steps to close the long-standing loopholes that are at the foundation of state financing and payment schemes. New policies and oversight changes can be made in a thoughtful manner over time. Delaying federal action will only make it more and more difficult to rein in states and stop abusive financing and payment schemes.
1 Historical data from Congressional Budget Office (CBO), “Exploring the Growth of Medicaid Managed Care,” August 2018, www.cbo.gov/publication/54235; for current enrollment, see Kaiser Family Foundation (KFF), “10 Things to Know About Medicaid Managed Care,” March 2023, https://www.kff.org/medicaid/issue-brief/10-things-to-know-about-medica….
2 For more on the provider tax gimmick, see Committee for a Responsible Federal Budget (CRFB), “Medicaid Provider Taxes Inflate Federal Matching Funds,” September 2023, https://www.crfb.org/papers/medicaid-provider-taxes-inflate-federal-mat….
3 The supplemental payments were non-DSH payments and the hospitals were all DSH hospitals. See U.S. Government Accountability Office (GAO), “Medicaid: More Transparency of and Accountability for Supplemental Payments Are Needed,” Report no. GAO-13-48, November 2012, p. 27, https://www.gao.gov/assets/gao-13-48.pdf. (Medicaid costs refers to expenses incurred in providing Medicaid-covered services to Medicaid beneficiaries).
4 The Medicaid and CHIP Payment Access Commission (MACPAC) interviewed officials and stakeholders in several states. Stakeholders noted that the amount of funding from provider and local governments was used to determine the total amount of spending for state directed payment arrangements. See MACPAC, “Report to Congress on Medicaid and CHIP – Chapter 2: Oversight of Managed Care Directed Payments,” June 2022, pp. 38-40, https://www.macpac.gov/publication/june-2022-report-to-congress-on-medi…. Between July 1, 2021 and February 1, 2023, MACPAC attributed 69 percent of all directed payment spending to 22 directed payment arrangements that were each projected to increase payments to providers by more than $1 billion. Most of these arrangements were uniform rate increases which are typically financed by providers through provider taxes or IGTs. See generally MACPAC, “Directed Payments in Medicaid Managed Care,” June 2023, p. 4, https://www.macpac.gov/publication/directed-payments-in-medicaid-manage…. See also GAO, “Medicaid: Federal Guidance Needed to Address Concerns About Distribution of Supplemental Payments," Report no. GAO 16-108, February 2018, p. 18, https://www.gao.gov/products/gao-16-108 (In three out of four states reviewed by the GAO, most supplemental payments to hospitals were allocated based on the presence of funding from hospital or local government contributions for the nonfederal share of the payments, rather than the amount of services provided by each hospital. In some instances, actual payments to providers were subject to the availability of such funding.).
5 MACPAC, “MACStats: Medicaid and CHIP Data Book,” December 2023, Exhibit 17, https://www.macpac.gov/wp-content/uploads/2023/12/MACSTATS_Dec2023_WEB-….
6 Id. at Exhibit 24.
7 MACPAC, “Examining the Policy Implications of Medicaid Non-Disproportionate Share Hospital Supplemental Payments,” March 2014, https://www.macpac.gov/publication/ch-6-examining-the-policy-implicatio….
8 MACPAC, “MACStats: Medicaid and CHIP Data Book,” December 2023, Exhibits 24 and 25, https://www.macpac.gov/wp-content/uploads/2023/12/MACSTATS_Dec2023_WEB-….
9 MACPAC, “Report to Congress on Medicaid and CHIP – Chapter 2: Oversight of Managed Care Directed Payments,” June 2022, p. 42, https://www.macpac.gov/publication/june-2022-report-to-congress-on-medi….
10 Section 1115 of the Social Security Act authorizes states to implement experimental, pilot, or demonstration projects that allow costs that would not otherwise be eligible for federal matching funds, including supplemental payments paying hospitals for uncompensated care costs and making incentive payments for broad health care improvements.
11 MACPAC, “MACStats: Medicaid and CHIP Data Book,” December 2023, Exhibit 24, https://www.macpac.gov/wp-content/uploads/2023/12/MACSTATS_Dec2023_WEB-….
12 Pass-through payments were typically not tied to the use of Medicaid services or performance on measures of quality or access, which prompted CMS regulations in 2016 introducing state directed payments and phasing out pass-through payments. MACPAC, “Directed Payments in Medicaid Managed Care,” June 2023, pp. 1-2, https://www.macpac.gov/publication/directed-payments-in-medicaid-manage….
13 Centers for Medicare & Medicaid Services (CMS), “The Use of New or Increased Pass-Through Payments in Medicaid Managed Care Delivery Systems” [Informational Bulletin], July 29, 2016, https://www.medicaid.gov/sites/default/files/federal-policy-guidance/do….
14 The phaseout will be fully concluded in 2027. See CMS, “Medicaid Managed Care, CHIP Delivered in Managed Care, and Revisions Related to Third Party Liability,” 81 Fed. Reg. 27,498, Final Rule (May 6, 2016), https://www.federalregister.gov/citation/81-FR-27498; see also CMS, “The Use of New or Increased Pass-Through Payments in Medicaid Managed Care Delivery Systems,” 82 Fed Reg 5415, Final Rule (January 18, 2017), https://www.federalregister.gov/citation/82-FR-5415.
15 This is a partial 2022 estimate as additional directed payments in effect for 2022 were approved as late as July 2023. See GAO, “Medicaid Managed Care: Rapid Spending Growth in State Directed Payment Needs Enhanced Oversight and Transparency,” Report no. GAO 24-106202, December 2023, p. 11, fn 28, https://www.gao.gov/products/gao-24-106202.
16 MACPAC, “Directed Payments in Medicaid Managed Care,” June 2023, https://www.macpac.gov/publication/directed-payments-in-medicaid-manage….
17 Id. at 4.
18 GAO, “Medicaid: CMS Needs More Information on States’ Financing and Payment Arrangements to Improve Oversight,” Report no. GAO-21-98, December 2020, https://www.gao.gov/products/gao-21-98.
19 Id. at 30.
20 GAO, “Medicaid Managed Care: Rapid Spending Growth in State Directed Payment Needs Enhanced Oversight and Transparency,” Report no. GAO 24-106202, December 2023, pp. 16-18, https://www.gao.gov/products/gao-24-106202.
21 Hospitals were generally unable to identify the amount of the supplemental payment surpluses they used for different projects, but the funding was substantial. One hospital had a Medicaid surplus of nearly $78 million, the same year it spent $100 million for construction of a new patient tower that included new operating rooms, emergency rooms, examination rooms, three floors of patient rooms, administration offices, and waiting rooms. Hospital officials reported that its capital improvements would not have been possible without the supplemental payments. See GAO, “Medicaid: Federal Guidance Needed to Address Concerns About Distribution of Supplemental Payments,” Report no. GAO-16-108, February 2016, https://www.gao.gov/products/gao-16-108.
22 The 40 percent requirement was established in 1965 when the Medicaid program was created.
23 Under the 40 percent requirement revenues states raise from provider taxes are considered state general funds.
24 This policy change would prohibit states from treating funds raised from providers (taxes and donations), including any special reserve funds or accounts that states may have created using funds from providers, as state general funds. Similarly, the policy change would prohibit provider taxes levied by local governments from being categorized as intergovernmental transfers to the state.
25 Based on detailed funding data from state fiscal year 2018 provide to the Committee for a Responsible Federal Budget by GAO, we estimate $440 billion of savings assuming those practices were carried forward. However, actual savings are likely to be far higher as 2018 does not capture the growth in state directed MCO payments (estimated to total $69.3 billion in 2021), which rely significantly on local governments and providers to fund the nonfederal share. See MACPAC, “June 2022 Report to Congress – Chapter 2: Oversight of Managed Care Directed Payments,” June 2022, https://www.macpac.gov/publication/june-2022-report-to-congress-on-medi….
26 CMS’ proposed rule would, inter alia, require provider payment levels not exceed the average commercial rate, condition state directed payment fee schedule payments upon the delivery of services, require states to report to CMS total dollars expended for each state directed payment and require states to submit state directed payment evaluations every three years if the SDP costs (as a percentage of total capitation payments) exceed 1.5 percent, require compliance with all federal laws concerning funding sources of the nonfederal share as a condition of SDP approval, and require states to ensure each provider receiving a SDP attest that it does not participate in any hold harmless agreement. See 88 Fed. Reg. 28,092, 28,110 (proposed May 3, 2023), https://www.federalregister.gov/citation/88-FR-28092.
27 For example, in the preamble to its proposed rule, CMS indicated that definitions of reasonable and appropriate state directed payments currently do not exist and proposed several regulatory standards in response. See 88 Fed. Reg. 28,092, 28,119 (proposed May 3, 2023), https://www.federalregister.gov/citation/88-FR-28092. Officials indicated that some of the provisions in the May 2023 proposed rule were designed to enhance fiscal oversight of state directed payments. See GAO, “Medicaid Managed Care: Rapid Spending Growth in State Directed Payment Needs Enhanced Oversight and Transparency,” Report no. GAO 24-106202, December 2023, p. 32, fn 65, https://www.gao.gov/products/gao-24-106202.
28 CMS officials told us the agency has taken some efforts to conduct back-end auditing of state directed payment expenditures in selected state through financial management reviews. Such reviews were underway in three states as of June 2023. GAO, “Medicaid Managed Care: Rapid Spending Growth in State Directed Payment Needs Enhanced Oversight and Transparency,” Report no. GAO 24-106202, December 2023, p. 32, https://www.gao.gov/products/gao-24-106202.
Tags
What's Next
-
Image

-
Image

-
Image