Why Has the Deficit Come Down Faster Than Expected?
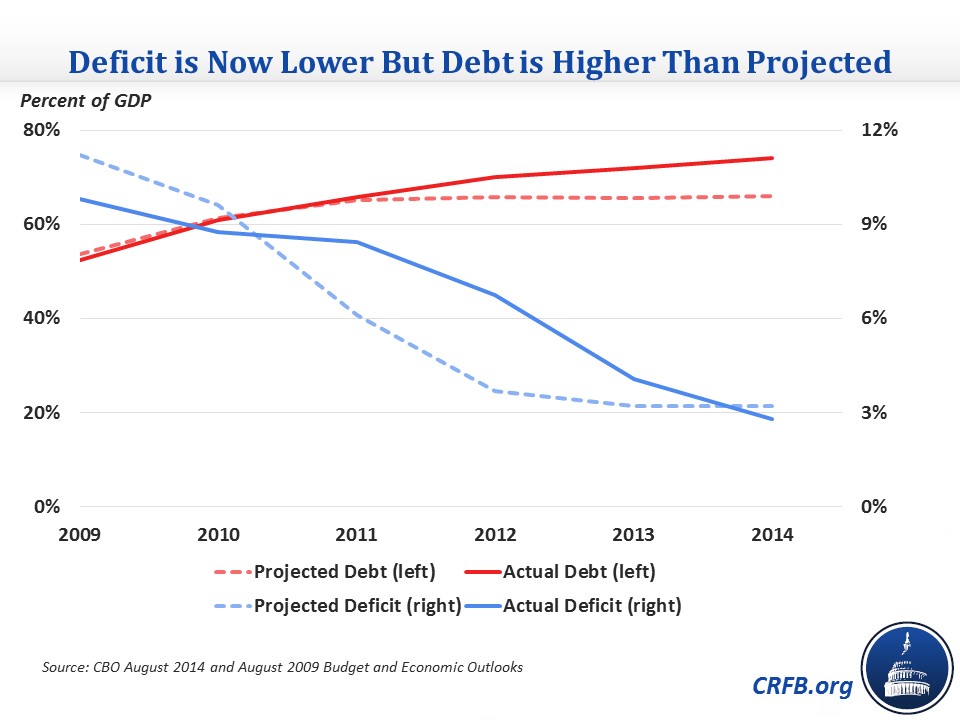
We noted in our discussion of the final Monthly Treasury Statement for 2014 that the deficit has fallen by two-thirds since 2009 after rising by nearly nine-fold between 2007 and 2009. However, much of this decline was already expected as a result of a recovering economy and unwinding stimulus, so another way to look at what's happened with the budget in the last five years is how the projected 2014 deficit has changed since 2009.
For this analysis, we use the August 2009 Congressional Budget Office (CBO) baseline as a starting point, since it was the first CBO update after the passage of the 2009 stimulus and when CBO and other economic forecasters were getting a better grasp at how deep the recession actually was. That baseline showed a projected 2014 deficit of $558 billion, $75 billion higher than the actual deficit of $483 billion. Notably, however, the projected deficit excluded the effects of the 2001/2003 tax cuts set to expire after 2010, even though it was widely expected that most or all of them would eventually be extended permanently. Also notable is that debt-to-GDP was only projected to be 66 percent of GDP in 2014 compared to the actual 74 percent; debt ended up being higher due to worse-than-expected economic performance, the aforementioned tax cut extensions, and further short-term stimulus.
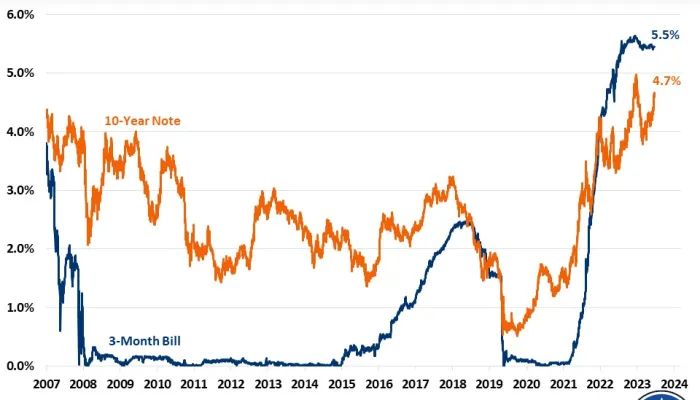
If you incorporate the presumption that all of the 2001/2003/2010 tax cuts would be extended into CBO's 2009 projections, then this year's official deficit was $375 billion lower than projected. $220 billion of that decline stems from changing economic and technical assumptions (including the $25 billion drop in the deficit since CBO's August 2014 update), and legislation prompted the remaining $155 billion reduction in 2014's deficit (primarily through discretionary spending cuts, the fiscal cliff deal, and the Affordable Care Act). Perhaps surprising at first blush is that changes to economic projections actually contributed $70 billion to the declining 2014 deficit, even though in 2009 CBO expected GDP to have reached its potential by now and unemployment to average 5 percent for the year. A slower than expected recovery, however, has also led to interest rates remaining extremely low, saving the government significantly on debt service costs.
Looking further into the technical changes, the bulk of the net effect came from two sources: health care and the two government-sponsored enterprises, Fannie Mae and Freddie Mac. The health care slowdown has been widely discussed and has been a positive trend not only for the medium and long term, but also for short-term deficits. Economic and technical changes to health care alone accounted for $70 billion of the drop in the projected deficit in 2014, with Medicare accounting for just over $35 billion, Medicaid accounting for $30 billion (mostly on net from NFIB v. Sebelius), and the exchange subsidies contributing $5 billion.
| Changes in the 2014 Deficit Since 2009 (Billions of Dollars) | |
| Category | 2014 Cost/Savings (-) |
| 2009 Projection of 2014 Deficit (assuming 01/03/10 tax cuts extended) | $858 |
| Legislative Changes | -$155 |
| Discretionary Caps/Sequester | -$155 |
| Affordable Care Act* | -$50 |
| High-Income Tax Increases (ATRA) | -$40 |
| Tax Extenders, UI, Bipartisan Budget Act, and Other | $95 |
| Economic and Technical Changes | -$220 |
| Health Care | -$70 |
| Fannie/Freddie | -$75 |
| TARP | -$5 |
| Economic Changes | -$75 |
| Other | $5 |
| Total Effect | -$375 |
| Actual 2014 Deficit | $483 |
Source: CBO, OMB
*Represents original cost estimate of ACA. Subsequent revisions would show up in economic and technical changes.
The Fannie/Freddie category has had a big turnaround since 2009, going from a big coster in the budget to a cash cow for the Treasury. The swing in actual versus projected spending totals almost $75 billion -- CBO expected in 2009 net spending of $5 billion, but the actual effect this year has been to return $70 billion to the Treasury.
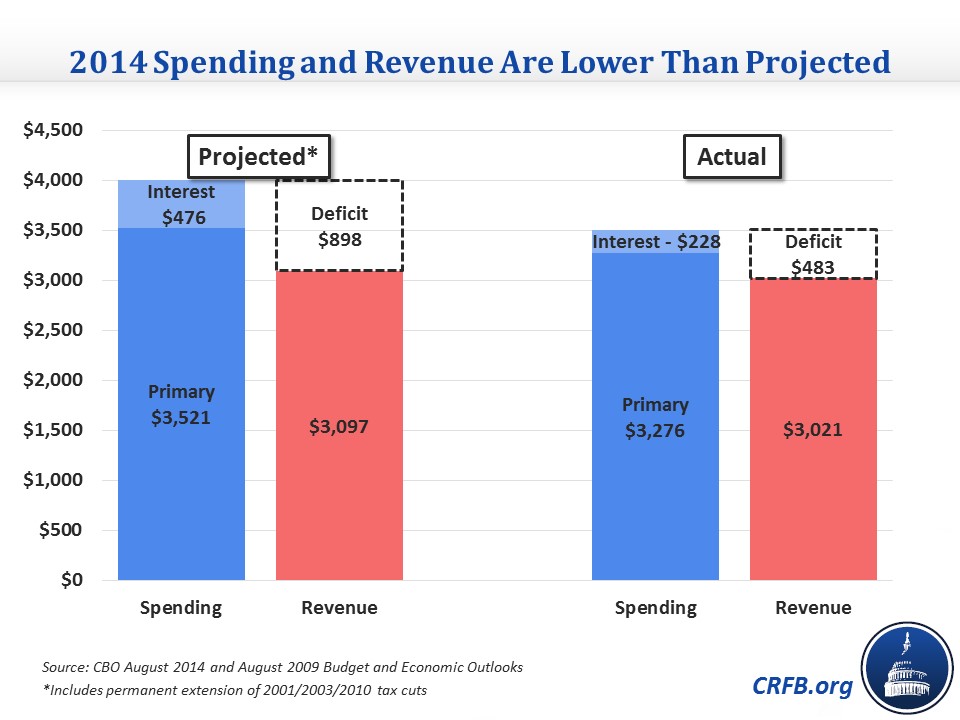
Overall, projected spending and revenue ended up being about $455 billion and $80 billion lower, respectively, than expected in 2009. Obviously, the revenue drop comes from tax extenders plus worse economic projections, while the spending decreases came from a variety of sources.
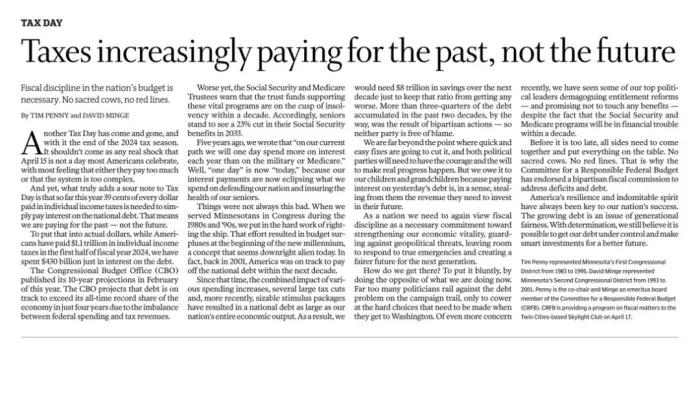
When it comes to fiscal health, what ultimately matters is not how the actual numbers compared to past projections but what those numbers show. And what we have is very high debt by historical standards that is only projected to grow.
What's Next
-
Image
-
Image
-
