Scoring Clinton and Trump with Different Growth Assumptions
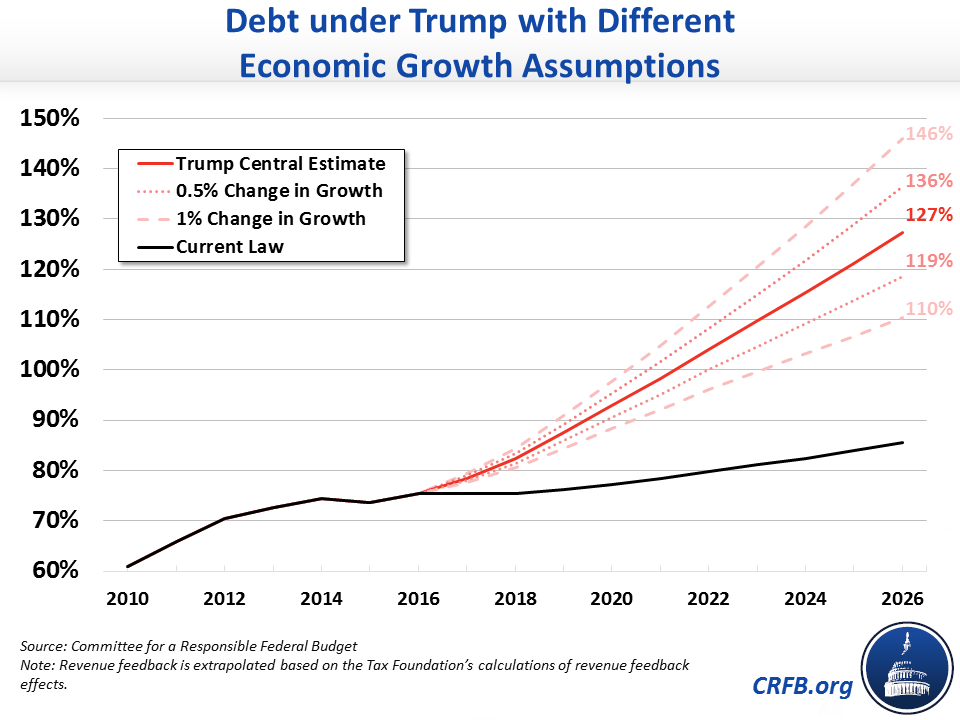
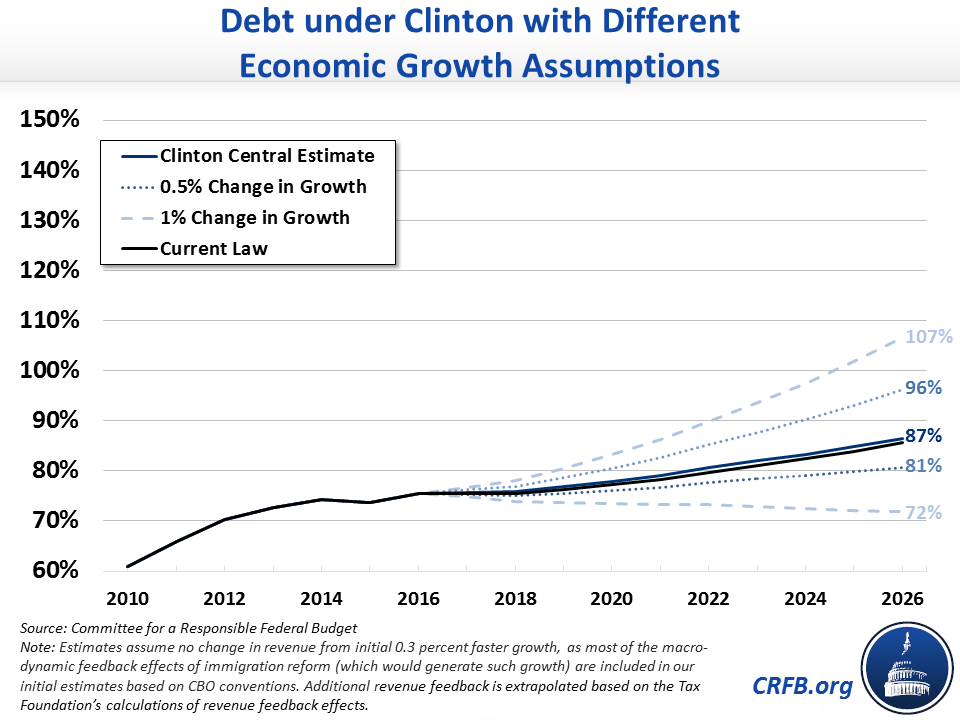
In our analysis "Promises and Price Tags: A Fiscal Guide to the 2016 Election," we compared the fiscal effects of the policies proposed by presumptive presidential nominees Donald Trump and Hillary Clinton. Our central estimates showed Trump would add $11.5 trillion to the debt by 2026 while Clinton would add $250 billion, pushing debt as a percentage of Gross Domestic Product (GDP) to 127 percent and 87 percent, respectively.
Our analysis relied on the economic projection of the Congressional Budget Office (CBO) that real economic growth will average about 2.1 percent annually over the next decade. But how would our results change if growth differed?
Based on our rough estimates,* different economic growth projections would have a noticeable difference on the level of debt in 2026 under either candidate's agenda.
For Donald Trump, we estimate that if real economic growth were 0.5 percentage points (about 25 percent) faster each year over the next decade, debt would rise to 119 percent of GDP rather than 127; if growth were 1 percentage point (about 50 percent) higher, debt would rise to 110 percent of GDP. On the other hand, if economic growth were 0.5 percentage points (25 percent) lower, debt would reach 136 percent of GDP; if it were 1 percentage point (about 50 percent) lower, it would reach 146 percent.
For Secretary Clinton, 0.5 percentage points (25 percent) faster annual growth would result in debt reaching 81 percent of GDP by 2026; while 1 percentage point (50 percent) faster annual growth would lead debt to actually fall slightly from current law, to 72 percent of GDP by 2026. Conversely, with 0.5 percentage points (25 percent) of slower growth, debt would rise to 96 percent of GDP by 2026; with 1 percentage point (50 percent) slower growth, debt would rise to 107 percent.
Importantly, growth rates that are either 1 percentage point higher or lower over a ten-year period would be quite unlikely. Assuming such growth rates were achieved through changes in productivity increases, the total factor productivity growth rate would have to average 2.3 percent per year on the high end and 0.3 percent on the low end, neither of which has been experienced over any ten-year period in the past half century.
A 0.5 percentage point variability in growth rates is much more feasible, yet does not change the story of our analysis by very much. Faster growth would certainly improve the fiscal outlooks under either candidate, but it would not be sufficient to put debt on a clear downward path from its current post-war record high levels. And slower growth, unfortunately, would worsen an already bleak fiscal picture.
A plan to reduce the long-term debt while reforming taxes and entitlement spending would serve both as insurance in case of slower economic growth and a tool to spur faster economic growth. We hope as the campaign continues that both candidates put forward such a plan.
Read the full "Promises and Price Tags" paper, and check out the accompanying chartbook.
This policy explainer is a part of our Fiscal FactCheck series on the 2016 presidential election. Read more policy explainers and factchecks:
- Promises and Price Tags: A Fiscal Guide to the 2016 Election
- Hillary Clinton: Policy Explainers and Fiscal FactChecks
- Donald Trump: Policy Explainers and Fiscal FactChecks
- Fiscal FactCheck: 2016 Campaign - A Project of the Committee for a Responsible Federal Budget
*Faster economic growth would reduce future debt burdens by increasing the denominator of the debt-to-GDP measure, increasing government revenue collection, reducing certain spending on means-tested programs, and reducing spending on debt service as a result of lower debt levels . Partially offsetting these results, higher growth would tend to lead to higher interest rates and therefore debt service costs while also increasing the long-term cost of Social Security, Medicare, and several other programs with costs directly or indirectly linked to overall economic growth. For simplicity, our analysis of growth assumes only the revenue effects of growth under the assumption that the debt service savings and savings on means-tested programs are roughly cancelled out by the cost of higher interset rates and various entitlement programs – at least over the ten-year period. The actual growth impact would differ somewhat. The revenue effects of the first 3.3 percent total increase in GDP by 2026 for Clinton are already incorporated into our central estimate based on CBO's conventions; we only credit further revenue from growth after the first 3.3 percent for Clinton.


