The Most Misleading Chart You'll See This Week
Late last week, the Council of Economic Advisors (CEA) released the annual Economic Report of the President outlining the Administration's latest economic policies and priorities. The report includes a wealth of useful information, including a section on health care which is definitely worth a read.
However, one part of the health section includes a graph that -- absent more information -- could be used to suggest health care cost-growth is no longer a threat to our fiscal sustainability. Specifically, the CEA report includes a chart showing that if, over the next 75 years, per capita Medicare spending grew at the same nominal rate as it has on average over the past 5 years (3.6 percent), then Medicare spending in 2085 would be about the same as today.
The report rightly states that "this should not be interpreted as a forecast but rather an indication of how sensitive long-term projections are to the assumed rate of growth of Medicare spending per beneficiary," but it could be misunderstood as it continues to receive a great deal of attention from a number of bloggers and commentators.
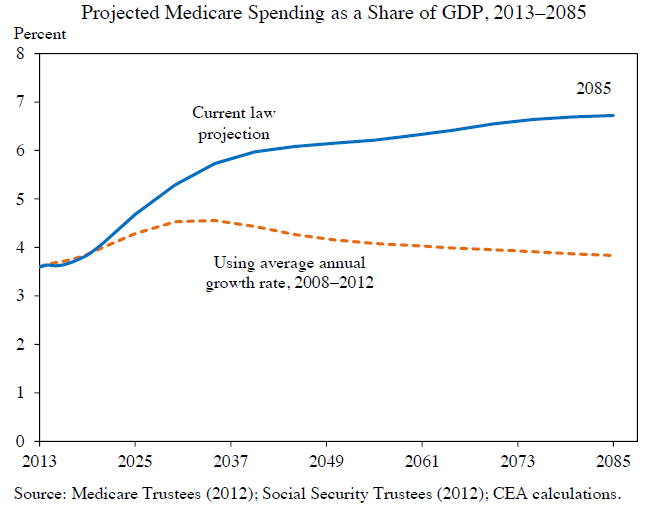
To be clear, there is no evidence that currently exists suggesting federal Medicare spending will be flat as a share of GDP, and the analysis to suggest that might be true is deeply flawed in a number of ways.
As we've discussed many times before on this blog, and as the report itself emphasizes, recent health care cost growth has in fact slowed substantially over the last several years -- a positive sign that we hope (but aren't sure) will continue. There is much debate surrounding how much of the recent reduction in health spending is due to a temporary reduction in spending due to the recession, how much to a structural reduction in the overall level of health spending, and how much due to a structural reduction in the growth rate of health spending.
It would be our hope that a larger portion than projected of the slowdown is due to changes in the growth rate. But as we show below,drawing assumptions from the CEA would be a big mistake for four central reasons:
Any assertion that per capita health costs will continue growing at 3.6 percent per year suffers from a number of flaws, including:
- Assuming the continuation of nominal not real growth trends (i.e. not accounting for inflation)
- Ignoring the effect of one-time level-reducing Medicare cuts from the Affordable Care Act
- Failing to account for aging within the Medicare population as more baby boomers reach their 80s and 90s
- Assuming 100 percent of the health spending slow-down is due to a reduction in the growth rate rather than level of spending, a highly unlikely scenario
Using nominal variables -- The average per beneficiary growth rate over the last five years has been 3.6 percent, but that was in a period of relatively low inflation. Over that time, by our estimates, inflation has only averaged around 1.6 percent -- meaning real growth has been close to 2 percent. The Medicare Trustees project long-term inflation will be roughly 2.4 percent a year, suggesting that if real growth stayed constant, costs would be growing not at 3.6 percent, but at 4.4 percent per year. This is a significant difference. If real Medicare spending per beneficiary grew at the same rate as the last five years, spending in 2085 would be closer to 6.5 percent of GDP rather than 3.8 percent.
Source: Rough CRFB calculations based on estimates from the Congressional Budget Office and the Social Security and Medicare Trustees.
Failing to Account for the ACA -- Assuming growth in future years will reflect growth over the last five years also ignores the fact that some of the slower growth is due to legislative Medicare spending cuts from the Affordable Care Act (ACA). In fact, by our rough estimates, growth over the last decade would have been closer to 4.1 percent (2.5 percent in real terms) absent those Medicare cuts. Importantly, some of those ACA cuts are meant to slow growth, such as productivity adjustments to certain providers, but other cuts just reduce the level of Medicare spending (i.e. the reductions in subsidies to Medicare Advantage plans). When we remove the one-time level-reducing cuts, spending still would have grown about 0.3 percentage points faster -- roughly 3.9 percent in nominal terms and 2.3 percent in real terms. If we were to assume 2.3 percent real annual per capita growth, Medicare spending would reach almost 8 percent of GDP rather than the 3.8 percent in the CEA graph.
Aging of the Medicare Population -- Finally, the assumption that Medicare costs will continue to grow as they have the last five years chart does not account for the fact that the Medicare population itself is getting older. Right now, many baby boomers are still in their 60s and are generally healthier and therefore relatively cheap for the program. As they age into their 70s, 80s, and 90s, the cost per-beneficiary should go up. The increase in the average age of beneficiaries will continue through about 2053, according to the Social Security and Medicare Trustees.
Assuming the Slowdown is Entirely a Structural Change -- Setting aside the flaws above, relying entirely on recent growth rates to make projections would be effectively assuming that 100 percent of the slowdown is due to structural changes in the trajectory of health spending growth. Although there is substantial disagreement over the extent to which the cost-trend has slowed and some hopeful optimism that it is significant, few analysts believe this explains the entirety of what is going on. More likely, we are witnessing some combination of a temporary spending reduction due to the deep recession, a permanent reduction in spending levels due to structural changes, and a reduction in the growth rate of spending going forward. Specifically, multiple studies have shown a correlation between declines in employment, private health insurance, and consumer spending in recent years slowing health care cost growth rates. A careful read of the CEA report offers significant insight into each of these factors.
* * * * *
There is no question that Medicare cost growth has slowed over the past five years, and we are hopeful that part of this represents a fundamental shift in spending growth. If true, this fact would be very helpful for containing debt levels -- particularly over the long-run. However, a small sample of data should not be used or misused to suggest our task is over. This is especially true given that the primary driver of growing debt over the next couple of decades is actually the aging of the population and that many analysts (including the Medicare Chief Actuary) believe the Trustees' current law projections are not too pessimistic, but in fact too optimistic.
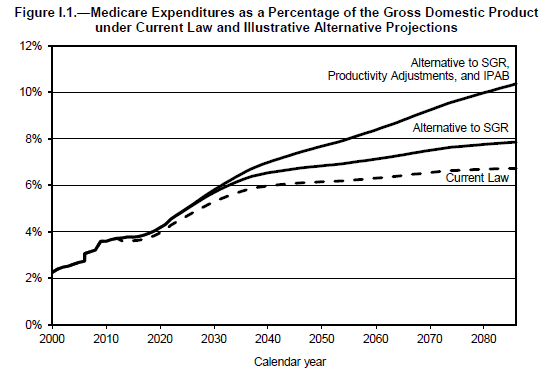
Source: Medicare Trustees
While there has been growing consensus in recent budget negotiations to reduce federal health spending, assertions that there is no problem based on back-of-the-envelope calculations offer a misleading distraction from the important work facing lawmakers to put health spending on a sustainable path.