It Depends on What you Mean by 'Equal'
A small controversy has been brewing in the blogosphere over the relative value of the higher-income 2001/2003 tax cuts and the Social Security shortfall. A couple of weeks ago, the Center on Budget and Policy Priorities displayed this graph, showing the present value of the two being roughly equal:

Some bloggers (but not CBPP) have held this up to essentially argue that we can let the top cuts expire to pay for Social Security. Others, meanwhile, have disputed CBPP’s findings or its relevance. Megan McArdle over at The Atlantic, for example, has argued that Social Security’s shortfalls would exceed the value of the trust funds in the out-years – a point which is obscured by using “present value” calculations. CBPP responded that while the Social Security shortfalls grows over time, so too do the value of the tax cuts (they further responded to McArdle’s concerns here). Over at his blog, Ezra Klein said he was “calling this one for CBPP, at least for the moment.” We aren’t so sure it’s that simple.
Present value calculations are an important way to measure our fiscal obligations. But cash flow matters too. Here is a graph comparing CBPP’s projections of the upper-income tax cuts to Social Security’s shortfalls as measured by the Trustees:
As you can see, the Social Security shortfall begins to exceed the value of the upper-income tax cuts at the very beginning of next decade, and is projected to be significantly larger over the course of the following quarter century.
So why do the cash-flow numbers make Social Security’s shortfall look so much larger? Well, there are two major reasons. First, by their very natures, present value estimates favor the near-term over the far term. This is logical, since a dollar today is worth more to us than a dollar tomorrow. But it also means that the first decade of relatively modest deficits (and brief surpluses) in Social Security weigh heavily on the calculation.
Secondly, these calculations include the value of the $2.6 trillion Social Security trust fund – and weight those heavily since we are holding that money today. If we were looking at the present value of Social Security’s future shortfalls, as opposed to accounting for its past surpluses (which have accumulated in the trust fund), the program’s unfunded costs would be closer to 0.9 or 1 percent of a GDP, rather than 0.7 percent. (That 0.7 percent isn’t irrelevant, since most reform plans would rely on the trust fund, at least for a while. But looking out to the end of the 75-year window, the gap will reach 1.4 percent of GDP.)
Aside from these cash-flow issues, we also have some concerns about CBPP’s methodology for projecting forward the value of the tax cuts – which appears to be highly sensitive to a few uncertain assumptions.
Essentially, CBPP assumes that the growth rates in revenue loss from 2017 through 2020 will continue forever. Over time, the compounding effects of these growth rates are significant -- increasing the value of the cuts to about 1.1 percent of GDP by 2080. Yet tiny changes in some of the numbers they use can drastically alter this number.
For example, they estimate that the tax cuts will cost $99 billion in 2017 and $120 billion in 2020 based off of a combination of Treasury and TPC estimates. We used some TPC tables to estimates these numbers at $102 billion in 2017 and the same $120 billion in 2020. When we tried to roughly apply their methodology using our $102 billion instead of their $99 billion (in other words, a nominal growth rate of about 5.6% instead of 6%) we found that the shortfall only reaches about 0.65 percent of GDP rather than 1.1 percent.
This is not to say that our $102 billion is right and their $99 billion is wrong – both are plausible and surely both will be wrong. The point is that tiny changes in these numbers cause wild swings in the ultimate cash flow results. (Though the magnitude of the present value cost wouldn’t swing nearly as much – under the scenario we presented, the present value of the upper-income cuts would be between 0.5 and 0.6 percent of GDP rather than 0.7 percent).
We also tried projecting forward two other ways: assuming that the upper income tax cuts remained a fixed proportion of total revenue under CBO’s extended baseline scenario and assuming bracket creep for the upper-income cuts in line with the total bracket creep we estimate in our CRFB baseline.
Here are the results:
Note: CBPP estimate (blue line) is the same line from the above graph.
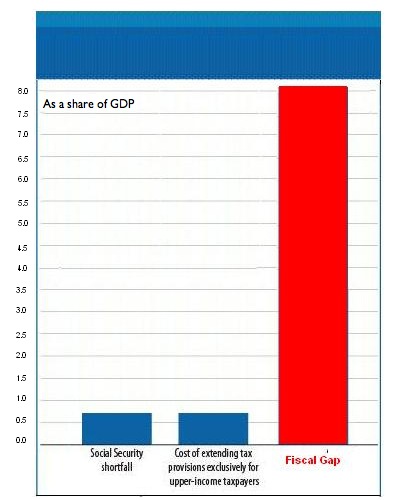
We have one more point – a point which CBPP has rightly made many times: reforming Social Security and letting the upper-income tax cuts expire is not an either or question. Based on CBPP’s estimates, doing both would generate present value savings of 1.4 percent of GDP or so. Based on CBO’s 2009 alternative baseline, the fiscal gap is more like 8 percent over the next 75 years.* That means we will need to do the fiscal equivalent of letting the top income tax cuts expire AND reform Social Security AND a whole lot more. This is what CBPP's graph from above would look like if we compared the costs of upper-income tax cuts and Social Security shortfalls to the fiscal gap:
Those who think that reforming Social Security is a fiscal imperative but there is no need to pay for the expiring tax cuts simply aren’t being honest with themselves. As CBPP argues, it’s “time for hard choices – not hypocrisy”.
*Note that we used the 2009 Alternative Fiscal Scenario because it assumes that the upper-income tax cuts are renewed. The 2010 Alternative Fiscal Scenario assumes that only the tax cuts for those below $250,000 a year are renewed, and that after 2020 revenue is fixed as a percent of GDP. Also note that numbers are not strictly comparable.
What's Next
-
Image

-
Image

-
Image