How Does COVID Relief Compare to Great Recession Stimulus?
We have published an abbreviated update of this analysis, incorporating additional legislation. We now find the COVID-19 response to be larger than the response to the Great Recession as a percentage of five-year GDP.
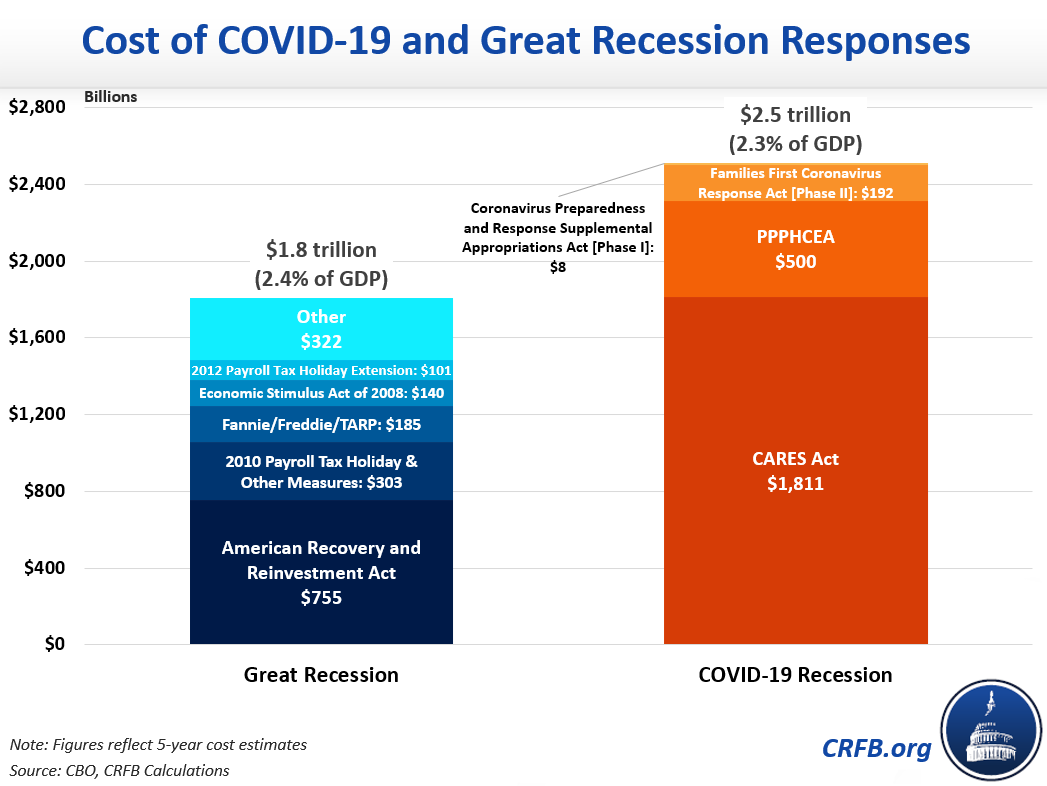
Congress has enacted five pieces of legislation and committed $3.6 trillion of fiscal support so far to address public health and economic crises related to COVID-19. We estimate these bills will cost the federal government about $2.5 trillion over the next five years. In a previous analysis, we compared the first three support measures to those enacted during the Great Recession between 2008 and 2012; we found them to be similar in size as a percentage of GDP. However, while the Great Recession funds were mostly distributed over five years, the current relief will be distributed in just six months.
In this piece, we update our previous analysis in light of additional legislation, updated cost estimates, and new economic projections. We continue to find the 2020 fiscal response is several times larger than in 2008 or 2009, but similar in size over a five-year period.

This blog post is a product of the COVID Money Tracker, a new initiative of the Committee for a Responsible Federal Budget focused on identifying and tracking the disbursement of the trillions being poured into the economy to combat the crisis through legislative, administrative, and Federal Reserve actions.
Between 2008 and 2012, the federal government enacted roughly $1.8 trillion of fiscal stimulus and other economic support (we tracked these and other measures at Stimulus.org and detailed them in our previous analysis). By comparison, we estimate legislation enacted to combat the current crisis will cost roughly $2.5 trillion over the next five years. As a share of five-year GDP, these figures are almost identical – totaling 2.4 percent and 2.3 percent, respectively.

Because the Paycheck Protection Program (PPP) is under-subscribed, we believe this bill would cost less than scored by CBO. However, the Paycheck Protection Program Flexibility Act would increase the direct and indirect cost of the PPP so we assume it restores net costs to CBO’s score. This assumption is rough and represents an approximation rather than an effort to re-estimate the legislation.
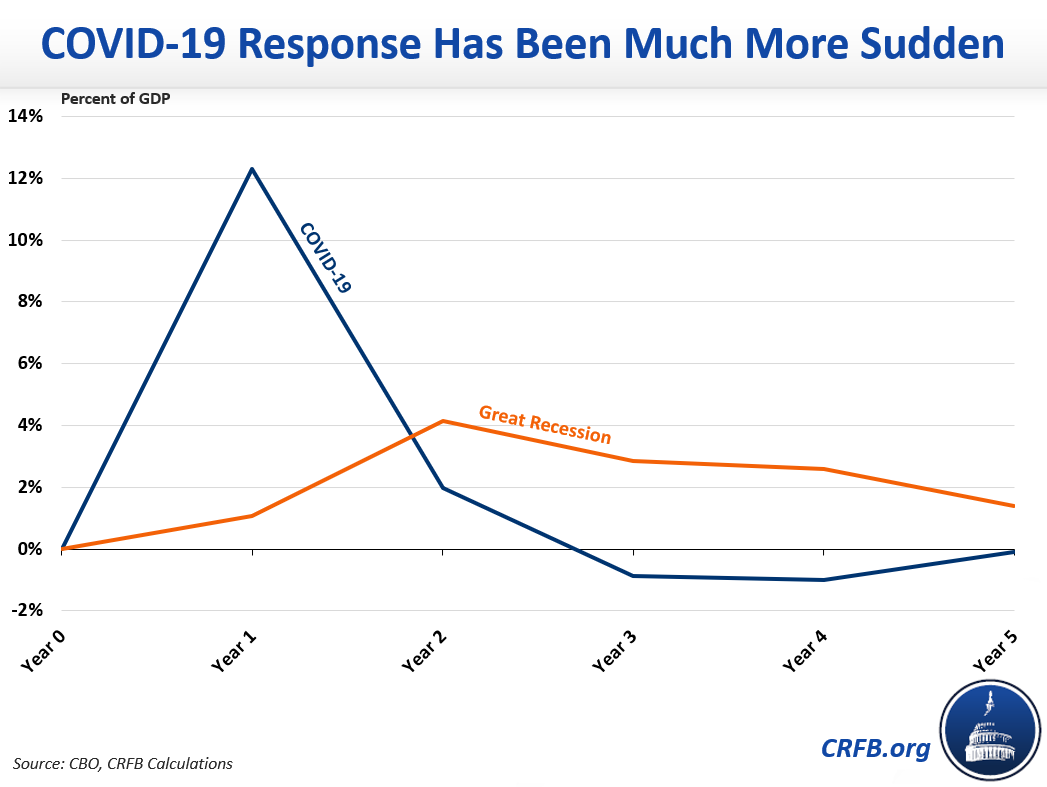
While the size of the response is comparable over a five-year period, the money has been spent much more quickly this time. Fiscal support during the Great Recession spent out gradually between 2008 and 2012. By comparison, we estimate $1.8 trillion of current relief money is already out the door and the entire $2.5 trillion five-year cost will be spent by October 1 of this year. Some additional support in fiscal year 2021 will be offset by savings, timing shifts, and loan repayments in subsequent years.
Economic rescue measures will cost 12 percent of GDP in fiscal year 2020 – compared to only 1 percent of GDP in 2008 and 4 percent in 2009. However, stimulus spending declined only gradually between 2009 and 2012 whereas under current law it will turn negative in 2022 and beyond.

Of course, this analysis likely will change if additional legislation is enacted. Different methodologies could yield different results – our estimates rely on cash accounting and exclude the effects of automatic stabilizers. However, the underlying conclusion is clear. Over the course of just six months, the federal government will have spent about as much to combat the COVID recession as it spent to fight the Great Recession over five years.
You can track relief spending at COVIDMoneyTracker.org.


