Highlights from CBO's New Data on Income Distribution and Taxes
The CBO has updated its data on the distribution of income and taxes. This analysis contains a wealth of data detailing changes in household income, tax rates, and other statistics since 1979. Below are some of the highlights from the report, drawing out trends since 1979 and how the new 2011 data factored in.
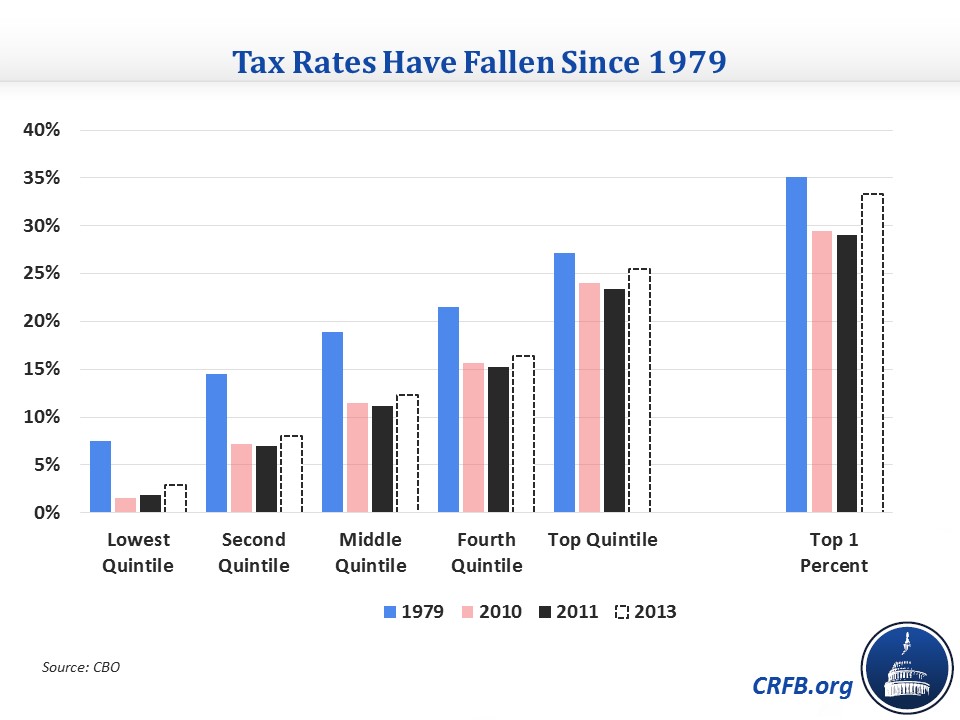
Tax rates have fallen for everyone since 1979 but have risen since 2011. This statistic is no surprise to those who noticed the relatively low revenue intake during and after the Great Recession. In 1979, the average tax rate was 22 percent, but after the tax cuts in the early 2000s, they fell to around 20 percent. Since the Great Recession, they have fallen further to around 18 percent as individuals' income declined and temporary tax cuts were put in place. The rate decreases were largest for the middle quintiles but were also fairly sizeable for the lowest earners and the top 1 percent. The one major change between 2010 and 2011 – the replacement of the Making Work Pay (MWP) tax credit with the payroll tax cut – made tax rates slightly more regressive, since many of the lowest earners benefited more from MWP, and the highest earners who didn't benefit from MWP could get the payroll tax cut. However, CBO's preliminary numbers for 2013 also show that changes in tax law since 2011, namely the fiscal cliff deal and taxes in the Affordable Care Act, have partially reversed the longer trend, raising tax rates for the bottom 99 percent by 1 percentage point and by 4 percentage points for the top 1 percent.
Income has risen much more for the top 1 percent than for everyone else. Inflation-adjusted after-tax income (including government transfers) has risen by 58 percent overall since 2011, but the bottom 90 percent of earners on average have seen income growth below that (a low of 35 percent for the middle quintile). The next 9 percent of earners (90th to 99th percentile) have seen their income grow by more than that, but less than the top 1 percent, who saw their income grow by 200 percent. As a result, the Gini index, a commonly used measure of income inequality, has increased from .358 to .436. Although taxes and transfers do more to reduce inequality than they did in 1979, the underlying distribution of income is much more skewed.
High earners pay more of federal taxes. Like the share of income, the share of federal taxes paid by the bottom 90 percent has also fallen from three-fifths in 1979 to 46 percent in 2011. The share paid by the next 9 percent of earners has gone up a bit, but the most dramatic rise has come from the top 1 percent: their share has increased from 14 to 24 percent. This change is driven more by rising incomes at the top than changes in tax law. However, the tax increases that went into effect in 2013 should increase both high-income tax rates and tax shares.

Health care-related items are growing rapidly. Rising health care costs show up in the data for both compensation and transfers. CBO counts employer-paid health insurance premiums as income and shows that the share of market income (pre-tax and transfer income) devoted to those premiums has risen from 3.1 percent to 4.3 percent since 1979, a near-doubling in inflation-adjusted dollars. This increase is about two percentage points greater for middle and upper-middle earners, who tend to get health insurance through their employer. A more dramatic difference due to health care costs is in transfers, where Medicare and Medicaid have been growing much faster than other programs. Those programs' share of all transfer income more than doubled from 20 percent to 42 percent.
Tags
What's Next
-
Image
-
Image
-
