Determining Medicare's Underlying Growth
Despite the noted acceleration in broader health care spending this year (likely due in large part to coverage expansions), Medicare continues to grow at an astoundingly slow pace.
Last month, we noted that Medicare's spending growth in 2014 had been extraordinarily low in the first seven months of the fiscal year at 0.7 percent, but that growth rate was also being subdued by temporary policies.* Removing those effects, the underlying growth rate was 3.1 percent, still very low and slower than projected economic growth and Medicare beneficiary growth for the fiscal year. With CBO's May Monthly Budget Review being released, we have another data point to see how Medicare growth looks now through the first two-thirds of the fiscal year.
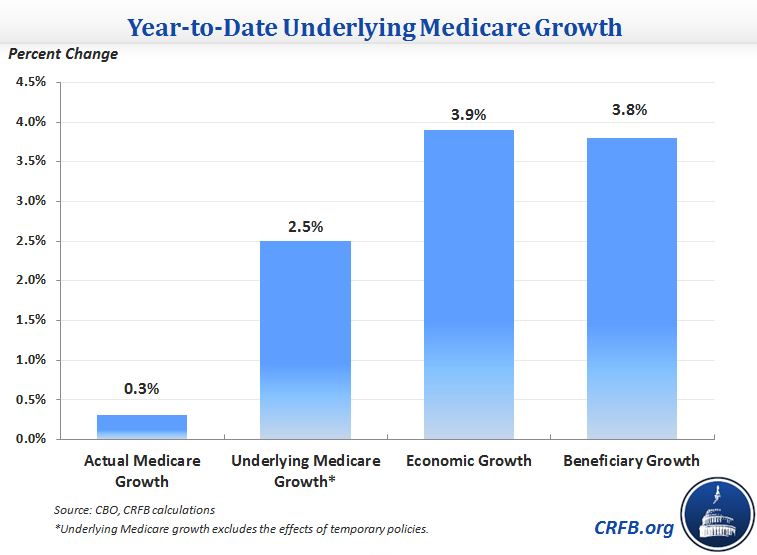
Adjusted for timing shifts, Medicare growth is even lower through eight months at just 0.3 percent. And even after removing the effects of temporary policies, year-to-date Medicare growth remains extremely low at 2.5 percent, even lower than through April. This is more than a full percentage point below economic and beneficiary growth, meaning that even excluding one-time effects, Medicare spending is on pace to both fall as a percent of GDP and on a per-capita basis.
* The temporary policies holding down spending growth are the Medicare sequester (which wasn't in effect for part of FY 2013), payment reductions in the Affordable Care Act for home health agencies and Medicare Advantage plans, ramped-up hospital re-admission penalties, and frozen means-tested Medicare premium income thresholds. On the other side, the gradual filling in of the Part D "donut hole" increases spending growth.


