2023 Deficit Hit $1.7 Trillion
The U.S. Department of the Treasury released its final Monthly Treasury Statement for Fiscal Year (FY) 2023, showing a $1.7 trillion deficit for the year, with $4.4 trillion of revenue collections funding $6.1 trillion of outlays. Removing the effects of announced student debt cancellation that the courts ruled illegal, the deficit totaled $2.0 trillion in FY 2023, which is double the $1.0 trillion deficit without cancellation in FY 2022 and $493 billion (32 percent) higher than the $1.5 trillion deficit the Congressional Budget Office (CBO) projected in June. Officially, the deficit grew $320 billion (23 percent) from the $1.4 trillion deficit recorded in FY 2022.

Although the FY 2023 deficit was lower than the FY 2020 and FY 2021 pandemic-driven deficits of $3.1 trillion and $2.8 trillion, respectively, it was higher in nominal dollars than any other time in history. As a share of the economy, the official deficit was 6.3 percent of Gross Domestic Product (GDP) and the effective deficit was 7.5 percent of GDP – which was larger than any time in U.S. history outside of a war, recession, or national emergency.
As deficits remain high, debt continues to rise. Federal debt held by the public rose by $2.0 trillion in FY 2023, from $24.3 trillion at the end of FY 2022 to $26.3 trillion at the end of 2023. As a share of GDP, we estimate debt rose to 98 percent of GDP at the end of FY 2023, more than twice the 50-year historical average of 47 percent of GDP and within eight percentage points of the prior record of 106 percent of GDP set just after World War II.

Removing the effects of student debt cancellation, the $1.0 trillion increase in deficits between FY 2022 and FY 2023 can be explained by $391 billion of higher mandatory and discretionary spending, $184 billion of higher interest costs, and $457 billion lower revenue. As a share of GDP, almost all of the increase in the effective deficit relative to FY 2022 can be explained by lower revenue collections.
Specifically, revenue collections fell from $4.9 trillion (19.3 percent of GDP) in FY 2022 to $4.4 trillion (16.5 percent of GDP) in FY 2023. Individual income and payroll tax revenue declined by $327 billion (8 percent), driven by nearly $300 billion (24 percent) less in nonwithheld tax collections and a roughly $130 billion (52 percent) increase in tax refunds. These losses were likely caused by lower capital gains realizations in 2022, higher-than-anticipated Employee Retention Credit claims, a delay in tax payments for taxpayers affected by natural disasters, and other factors. Withheld taxes grew by only 4 percent, below the rate of nominal economic and income growth, largely because inflation-indexing of the tax brackets in 2023 caught up to the high inflation of 2021 and 2022.
Among other sources of revenue, Federal Reserve remittances fell by over $100 billion since higher short-term interest rates raised the Federal Reserve's interest expenses, wiping away most Federal Reserve banks' profits. Meanwhile, corporate taxes remained roughly flat in nominal dollars, while other sources of revenue, such as customs fees, fell modestly.
A Closer Look at the $1.7 Trillion FY 2023 Deficit
| Budget Area | FY 2022 | FY 2023 | % Change |
|---|---|---|---|
| Social Security | $1,219 billion | $1,354 billion | +11% |
| Medicare | $755 billion | $848 billion | +12% |
| Medicaid | $592 billion | $616 billion | +4% |
| Refundable Tax Credits | $292 billion | $171 billion | -42% |
| Coronavirus Relief Fund | $106 billion | $1 billion | -99% |
| Public Health and Social Services Emergency Fund | $92 billion | $28 billion | -70% |
| Food and Nutrition Service | $192 billion | $171 billion | -11% |
| Small Business Administration (mostly PPP) | $23 billion | $26 billion | 12% |
| Federal Deposit Insurance Corporation | -$9 billion | $92 billion | +1085% |
| Department of Education | $639 billion | -$41 billion | -106% |
| Military | $727 billion | $776 billion | +7% |
| Interest on the Debt | $475 billion | $659 billion | +39% |
| Other Spending | $1,168 billion | $1,433 billion | +23% |
| Total Official Spending | $6.3 trillion | $6.1 trillion | -2% |
| Withheld Individual Income and Payroll Taxes | $3,070 billion | $3,185 billion | +4% |
| Other Individual Income and Payroll Taxes, Net of Refunds | $1,046 billion | $604 billion | -42% |
| Corporate Income Taxes | $425 billion | $420 billion | -1% |
| Fed Remittances | $107 billion | $0.6 billion | -99% |
| Other | $249 billion | $230 billion | -7% |
| Total Revenue | $4.9 trillion | $4.4 trillion | -9% |
| Total Official Deficit | -$1.4 trillion | -$1.7 trillion | +23% |
| Memo: Effect of Student Debt Cancellation on Spending | -$379 billion | $333 billion | n/a |
| Memo: Total Effective Spending (Excludes Student Debt Cancellation) | $5.9 trillion | $6.5 trillion | +10% |
| Memo: Effective Deficit (Excludes Student Debt Cancellation) | -$1.0 trillion | -$2.0 trillion | +104% |
Sources: Congressional Budget Office, U.S. Department of the Treasury, and Committee for a Responsible Federal Budget.
Numbers may not sum due to rounding.
Although federal spending officially fell by $137 billion (2 percent) between FY 2022 and FY 2023, this was due to an accounting quirk where the President's announced student debt cancellation was recorded as a cost in FY 2022 – before being implemented – and then as a savings in FY 2023 after the Supreme Court ruled it illegal.
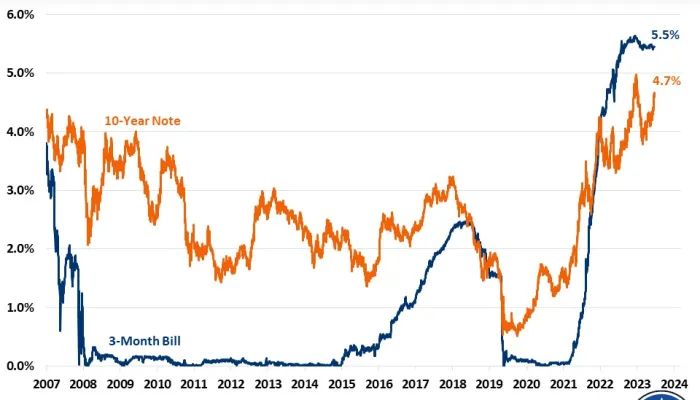
Removing this accounting quirk, effective spending rose from $5.9 trillion in FY 2022 to $6.5 trillion in FY 2023. Spending on Social Security increased by $135 billion (11 percent) to $1.4 trillion, largely due to the 8.7 percent cost-of-living adjustment. Medicare spending increased by $93 billion (12 percent) to $848 billion and Medicaid spending increased by $24 billion (4 percent) to $616 billion, both due to higher payment rates and growing enrollment, partially offset by unwinding COVID relief. Federal Deposit Insurance Corporation spending increased by $101 billion to $92 billion from facilitating the resolution of bank failures in the Spring of 2023. Interest costs also grew by a massive $184 billion (39 percent), from $475 billion to $659 billion because interest rates were significantly higher in FY 2023 than in FY 2022.
Partially offsetting this growth, spending fell in some areas as various COVID relief measures came to an end. Spending on refundable tax credits declined by $121 billion (42 percent) to $171 billion due to expiration of the expanded Child Tax Credit, while spending from the Coronavirus Relief Fund fell by $105 billion (99 percent) to $954 million, spending from the Public Health and Social Services Emergency Fund decreased by $64 billion (70 percent) to $28 billion, and spending from the Department of Agriculture's Food and Nutrition Service fell by $21 billion (11 percent) due to the ending of emergency allotments in the Supplemental Nutrition Assistance Program.
As a share of GDP, revenue declined from a near-record 19.3 percent of GDP in FY 2022 to a below-average 16.5 percent of GDP in FY 2023. Effective spending rose from 23.6 percent of GDP to 24.0 percent of GDP while official spending fell from 24.8 percent of GDP to 22.8 percent of GDP.

Unfortunately, the $2.0 trillion effective deficit in FY 2023 does not appear to be an aberration. One-time revenue windfalls in 2022 – driven largely by capital gains and inflation – are behind us. Meanwhile, interest rates continue to surge as more debt is issued or rolled over. Substantial action will be needed to keep debt from rising dramatically and to prevent an ultimate debt spiral. A fiscal commission would offer a helpful path forward.
What's Next
-
Image
-
Image
-
