What Would Clinton and Trump Need to Do to Address the Debt Along with their Policy Agendas?
We recently estimated that Clinton's policies would likely add $200 billion to the debt over the next decade, while Trump’s policies would add $5.3 trillion. We also found that the ratio of debt to Gross Domestic Product (GDP) would rise from nearly 77 percent of GDP today to 86 percent by 2026 under Clinton and 105 percent under Trump. Newer estimates of their tax plans (but not spending initiatives) from the Tax Policy Center suggest similar findings.
Debt cannot continue to rise faster than the economy indefinitely. Excessively high levels of debt harm economic growth and wages, squeeze out important national priorities, leave us less able to respond to future economic downturns, and, ultimately, are unsustainable. That means that if the candidates' plans are implemented, they will need to be accompanied or followed by reductions in spending, increases in revenue, or both to avoid leaving our nation on an unsustainable fiscal path.
But because the candidates have put forward plans that include so many expensive new promises, simultaneously achieving their policy agendas and taking measures to deal with our fiscal challenges would prove extremely difficult. In order to put the debt on a downward path relative to the economy by only raising tax rates on high earners, Democratic nominee Hillary Clinton would need to raise the top income tax rate to be near or above the revenue-maximizing level. Or, if Republican presidential nominee Donald Trump were to balance the budget without touching Social Security, Medicare, or defense – as he has said he would do – he would need to cut all other spending by more than 70 percent. These are some of the results of our latest analysis of what the candidates would need to do to reach fiscal sustainability under their campaign proposals.
As in our initial Promises and Price Tags report released in June, this analysis evaluates how much candidates would need to cut spending, raise taxes, or grow the economy to achieve various fiscal metrics – from stabilizing the debt-to-GDP ratio to balancing the budget within a decade.
While we look at spending cuts, taxes, and growth in isolation, the next president will almost certainly need to use a mix of the three to achieve sustainability.
How Much Would They Need to Cut Spending?
Achieving fiscal sustainability through spending cuts1 alone would require ambitious cuts for either candidate, and the cuts would be particularly sharp for Trump. Clinton would need to decrease total spending by 5 percent to stabilize debt as a share of the economy (or 7 percent if she also repeals the sequester as she has said she would do), and Trump would need to cut total spending by 15 percent. To balance the budget, Clinton would need to cut total spending by 14 percent (16 percent with sequester repeal), while Trump would need to cut total spending by 25 percent.

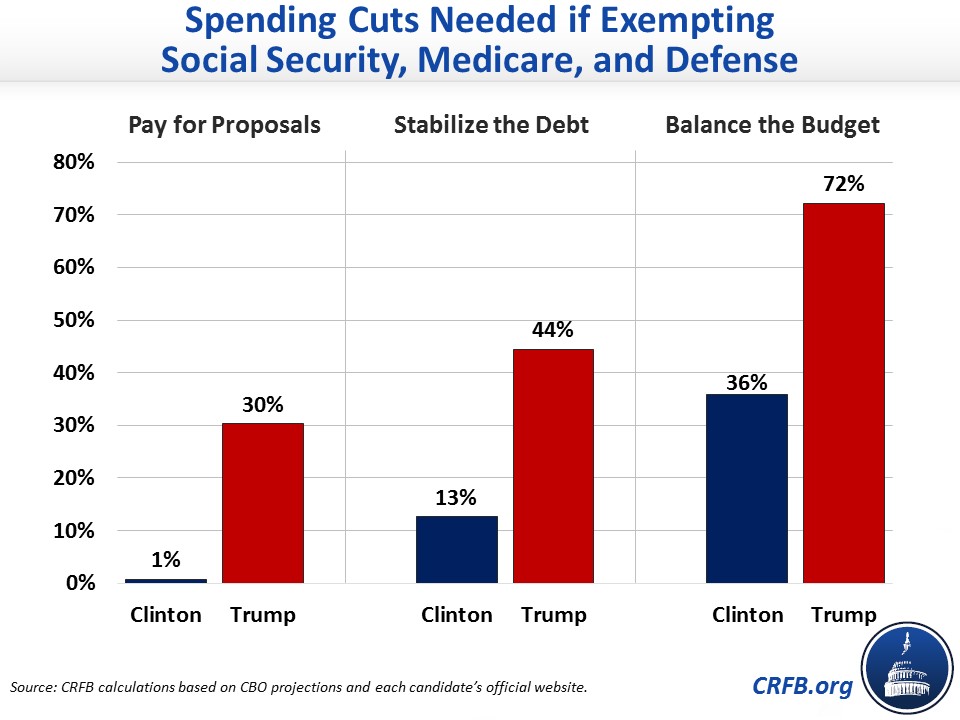
Yet both candidates have stated they wouldn't reduce Social Security – the largest federal program – and have called for net increases to the second largest program, defense. Both have platforms or statements that also imply they would be hesitant to cut Medicare.
Just exempting Social Security, Clinton would need to cut spending by 7 to 20 percent (reflecting stabilizing the debt to balancing the budget) and Trump by 22 to 35 percent. If Social Security, Medicare, and defense were all exempted, Clinton and Trump would need to cut remaining spending by 13 percent (17 percent with sequester repeal) and 44 percent, respectively, to stabilize the debt. To balance the budget, Clinton would need to cut other spending by 36 percent (39 percent with sequester repeal), and Trump would need to cut it by 72 percent.
The full range of cuts required to meet fiscal sustainability goals with different exemptions are in the Appendix table below.
How Much Would They Need to Increase Taxes?
Instead of cutting spending, Clinton and Trump could choose to raise tax revenues to slow the growth of the debt. In total, Clinton has already proposed an additional $1.5 trillion of net revenue increases over a decade, while Trump's plans would lose $5.8 trillion in net revenue.
If the nominees were to stabilize the debt through tax increases alone, Clinton would need an across-the-board2 income tax hike of 3 percentage points (4 points with sequester repeal) above her proposed tax increases, and Trump would need a hike of 9 percentage points relative to his cuts.
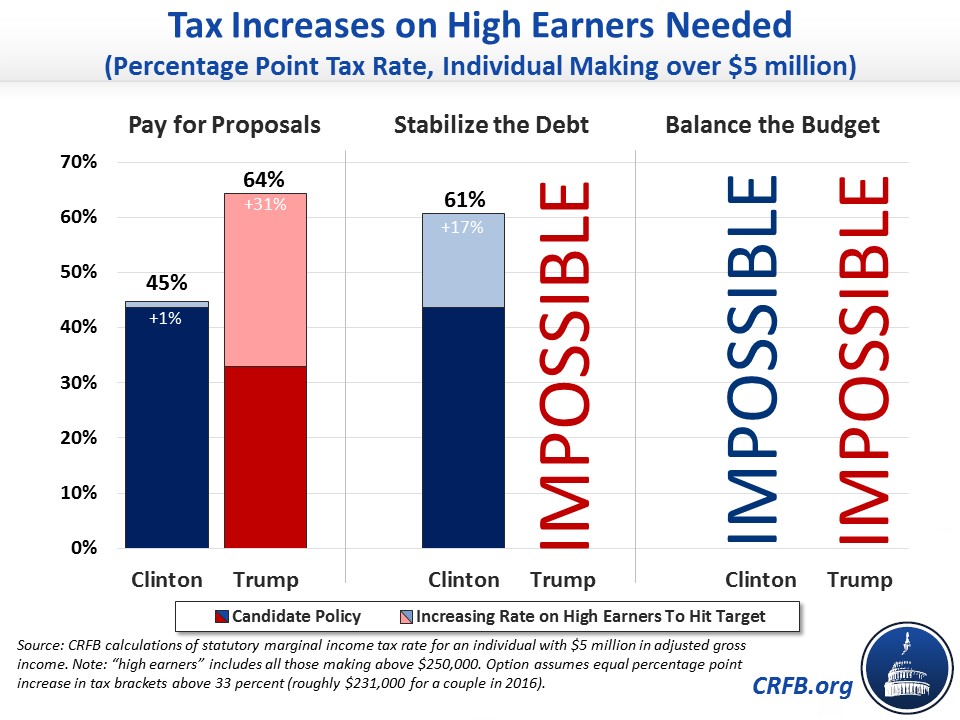
However, both candidates have also said they would not increase taxes on the middle class. Specifically, Clinton would not increase taxes on anyone making less than $250,000 per year, and Trump wants to lower taxes on the middle class generally.
If Clinton were to achieve fiscal sustainability through income tax rate increases on high earners alone, stabilizing the debt would require a 17 percentage point increase (22 points with sequester repeal) above her current proposed tax increases, pushing the top tax rate – currently 39.6 percent or 43.6 percent under her current proposals – to 61 percent. Accounting for other taxes, this would be around and perhaps even above what most economists believe to be the revenue-maximizing rate. The implied tax rate for Trump to stabilize the debt with only tax rate increases on high earners would be well above the revenue-maximizing rate and therefore impossible.
Balancing the budget would be impossible for either candidate without raising the tax rate over the revenue-maximizing level.
How Much Economic Growth Would They Need to Stimulate?
In theory, it is possible to put the debt on a sustainable path without spending cuts or tax increases, assuming a high enough level of economic growth.3 In practice, this growth is highly unlikely to be achievable. Still, faster economic growth can help reduce the debt-to-GDP ratio by increasing tax revenues and raising GDP.
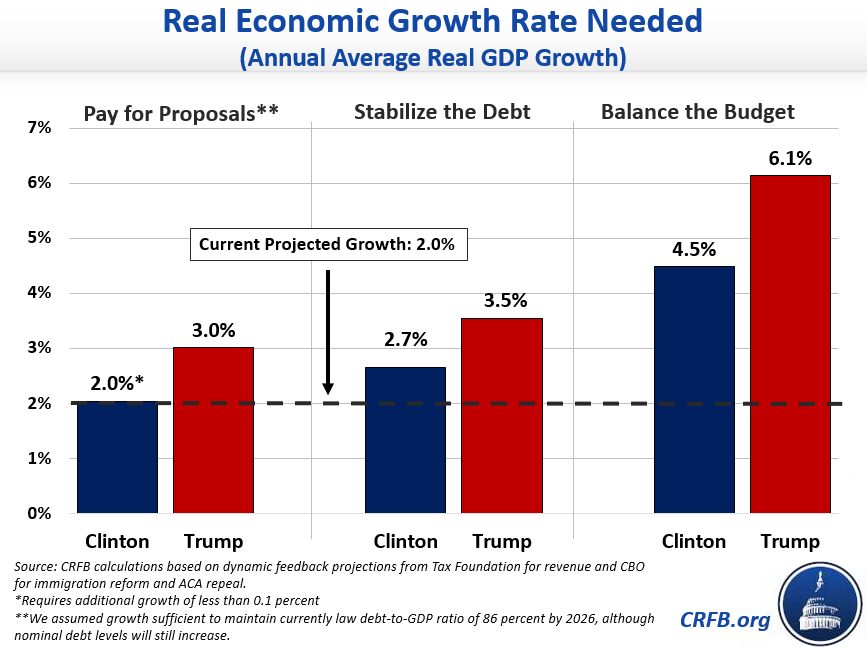
To stabilize the debt with economic growth, Clinton would need real GDP growth to average 2.7 percent annually (or 2.8 percent with sequester repeal). Trump would need to increase growth to an average of 3.5 percent annually over ten years. The last time the U.S. sustained 3.5 percent growth over a ten-year period was during the tech boom of the 1990s. But given our aging population, that rate of growth would be much harder today; it would likely require a level of productivity growth that has not been achieved in any decade in modern history.
Balancing the budget with economic growth alone would probably be impossible under either candidate’s proposals, particularly in Trump's case.
For Clinton, balancing the budget through growth alone would require 4.5 percent growth (4.7 percent with sequester repeal) – a sustained rate more than double projected levels and not seen in over four decades. Even with a higher population from immigration reform, 4.5 percent growth would require levels of sustained productivity growth never seen in modern history.
Under Trump's plan, growth would need to reach a sustained 6.1 percent annually – triple what most forecasters project. That's more than a full percentage point over the modern growth record (4.9 percent between 1958 and 1967) and would require productivity growth more than double what was achieved during that period.
In other words, no achievable level of economic growth alone can put the debt on a sustainable downward path in concert with either candidate's current fiscal plans, particularly under Trump’s plans.
Time to Get Serious
While Clinton has put forth a serious effort to pay for her proposals, neither candidate would address the unsustainable trajectory of our nation's debt – and Trump would substantially worsen it. Now more than ever, both candidates must tell us how they would confront our growing debt burden. It will take a mixture of spending cuts, tax increases, and entitlement reforms to produce the kind of growth and fiscal restraint necessary to put our debt on a sustainable path.
1 Cuts are calculated based on the necessary deficit reduction to reach each respective fiscal goal over the total amount of spending over the next decade under current law. Cuts could be either allocated across the board or by some other means. To stabilize the debt, we assume candidates would need to achieve $2.15 trillion of non-interest savings – resulting in a debt-to-GDP ratio of 76.6 percent of GDP by 2026. To balance the budget, we assume candidates would need to achieve $6.37 trillion of non-interest savings over a decade relative to current law, enough to balance the budget using a path based on the FY 2016 congressional budget resolution fit to the August 2016 CBO Baseline. The actual ten-year savings to balance could differ substantially based on how policies are implemented.
2 Throughout this section, our analysis for raising tax rates uniformly assumes that candidates raise each tax rate by an equal number of points. Thus, a 1-point across-the-board increase would change Trump’s tax brackets to 13, 26, and 34 percent, though it would not have any effect on the number of people that do not owe any income tax (a number that is expanded under Trump’s plan). As an illustrative example, we assume linearity – raising rates by 10 points would raise 10 times the amount as raising rates by 1 point. But in actual practice, less revenue would be raised as rates near the revenue-maximizing rate.
3 Empirical evidence suggests that higher economic growth is generally accompanied by higher interest rates. For simplicity, we assume that the cost to the government from higher interest rates is fully offset by the savings from lower debt service as a result of additional revenue. In reality, the net feedback effect of economic growth could be lower or higher depending on which of these factors dominated, but it would likely fall within 10 percent of our estimates in either direction.
Appendix table: Spending cuts needed to achieve various fiscal goals (percent of ten-year primary spending with stated exemptions)
| Exemptions | Pay for Proposals | Stabilize the Debt | Balance the Budget | ||||
|---|---|---|---|---|---|---|---|
| Clinton (w/ sequester repeal) |
Trump | Clinton (w/ sequester repeal) |
Trump | Clinton (w/ sequester repeal) |
Trump | ||
| No exemptions | <0.5% (2%) |
11% | 5% (7%) |
15% | 14% (16%) |
25% | |
| Exempting Defense | <0.5% (2%) |
13% | 6% (8%) |
18% | 17% (19%) |
30% | |
| Exempting Social Security | <0.5% (3%) |
15% | 7% (9%) |
|
20% (22%) |
35% | |
| Exempting Medicare | <0.5% (2%) |
13% | 6% (8%) |
19% | 18% (19%) |
32% | |
| Exempting Social Security and Defense | 1% (3%) |
19% | 9% (12%) |
28% | 25% (27%) |
45% | |
| Exempting Social Security and Medicare | 1% (4%) |
21% | 9% (12%) |
30% | 26% (29%) |
50% | |
| Exempting Medicare and Defense | <0.5% (3%) |
17% | 7% (10%) |
24% | 21% (23%) |
40% | |
| Exempting Social Security, Medicare, & Defense | 1% (5%) |
30% | 13% (17%) |
44% | 36% (39%) |
72% | |
Source: CRFB calculations.


