It's Showtime: CBO's New Budget and Economic Projections
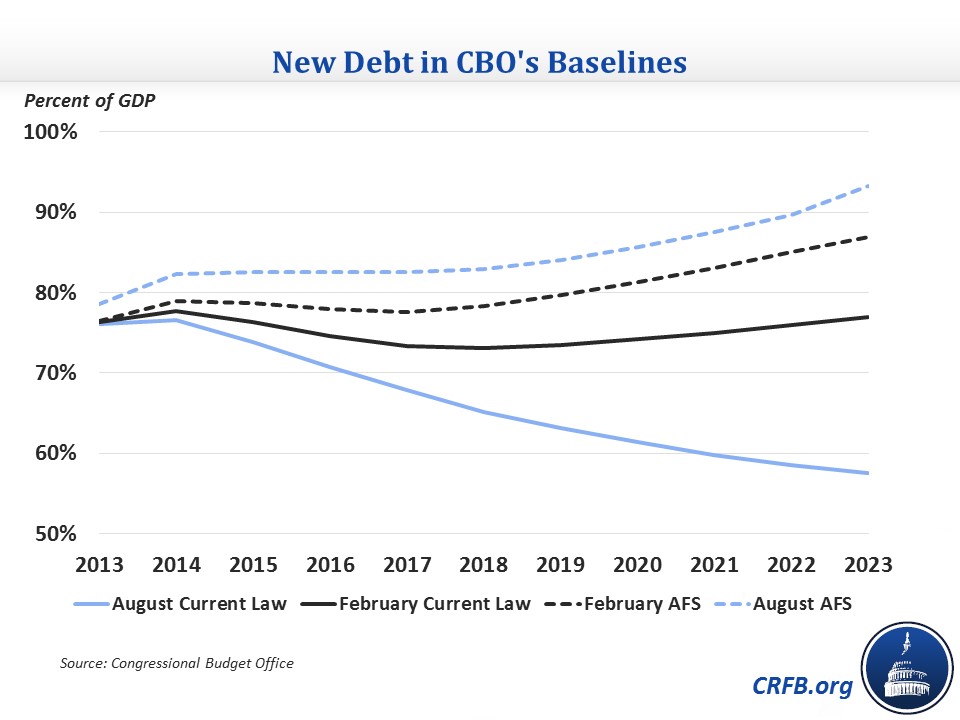
For 49ers and Ravens fans, the Super Bowl was the big game of the 2012 NFL season. For budget wonks, today is that day, as CBO has released its budget and economic projections. These projections show what we previously thought, that debt is on an upward path as a percent of GDP under CBO's current law and Alternative Fiscal Scenario projections. Current law debt is projected to reach 77 percent of GDP by 2023, while CBO’s AFS projections show debt reaching 87 percent.
Largely as a result of the fiscal cliff deal (the American Taxpayer Relief Act), current law deficits and debt are much higher than previously projected, given that the expiring tax cuts and AMT patches were extended for most households. Ten-year deficits will total nearly $7 trillion (3.3 percent of GDP on average) over the next ten years, whereas CBO’s August projections were $2.3 trillion in total deficits (1.1 percent of GDP).
Obviously, revenue projections have fallen significantly as a result of the fiscal cliff deal. They are now projected to average 18.9 percent of GDP over ten years, compared to 20.6 percent in their previous baseline. Spending is slightly higher, averaging 22.1 percent over ten years compared to 21.7 percent in their previous estimate.
| Budget Metrics in CBO's Current Law Baseline | |||||||||||
| 2014 | 2015 | 2016 | 2017 | 2018 | 2019 | 2020 | 2021 | 2022 | 2023 | ||
| Billions of Dollars | |||||||||||
| Spending | $3,618 | $3,803 | $4,067 | $4,300 | $4,542 | $4,811 | $5,078 | $5,350 | $5,691 | $5,939 | |
| Revenue | $3,003 | $3,373 | $3,591 | $3,765 | $3,937 | $4,101 | $4,279 | $4,496 | $4,734 | $4,961 | |
| Deficit | $616 | $430 | $476 | $535 | $605 | $710 | $798 | $854 | $957 | $978 | |
| Debt | $12,937 | $13,462 | $14,025 | $14,642 | $15,316 | $16,092 | $16,957 | $17,876 | $18,902 | $19,944 | |
| Percent of GDP | |||||||||||
| Spending | 21.7% | 21.6% | 21.6% | 21.5% | 21.7% | 22.0% | 22.2% | 22.4% | 22.9% | 22.9% | |
| Revenue | 18.0% | 19.1% | 19.1% | 18.9% | 18.8% | 18.7% | 18.7% | 18.9% | 19.0% | 19.1% | |
| Deficit | 3.7% | 2.4% | 2.5% | 2.7% | 2.9% | 3.2% | 3.5% | 3.6% | 3.8% | 3.8% | |
| Debt | 77.7% | 76.3% | 74.6% | 73.4% | 73.1% | 73.5% | 74.2% | 75.0% | 76.0% | 77.0% | |
Source: CBO
CBO also estimates an Alternative Fiscal Scenario, which assumes the sequestration is canceled, policymakers continue to enact “doc fixes” to avoid deep cuts to physician payments, and a number of temporary expiring tax provisions continue. Under this scenario, debt will rise to 85 percent of GDP by 2022 and 87 percent by 2023. By comparison, CBO’s previous AFS had debt rising to 90 percent of GDP in 2022. About 3 percent of GDP in the difference is attributable to the expiration of tax cuts for people making over $450,000 as a result of the fiscal cliff deal.

Later today, CRFB will be releasing a fuller analysis which goes into detail on CBO’s budgetary and economic projections. For those not on our email list, you will be able to find that document at https://www.crfb.org.


