Overview of the Federal Budget
| CLICK to see CRFB's blog The Bottom Line and to read our policy papers on the federal budget |
What Is the Federal Budget?

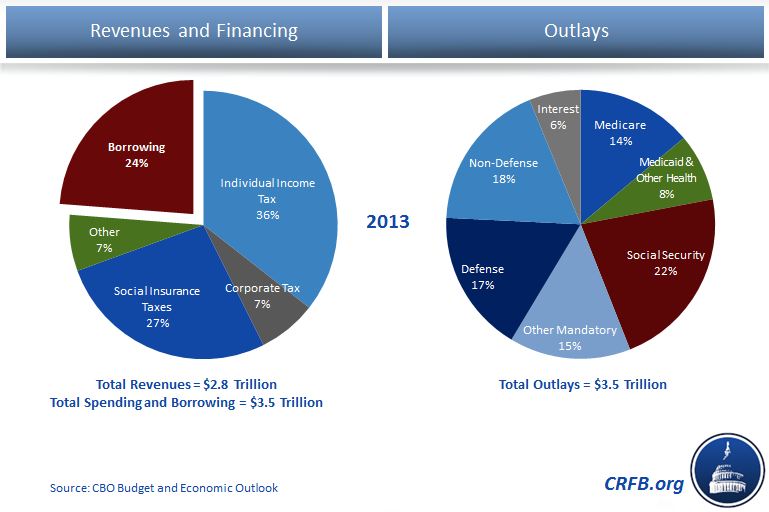
The U.S. federal budget is composed of thousands of federal spending programs that are financed through the tax code and through federal borrowing. The federal budget is a reflection of the federal spending and tax priorities of the country. However, over the past several years and each and every year going forward, revenues are insufficient to meet spending. As a result, the federal government is forced to borrow.
This year, borrowing will amount to nearly a quarter of the federal government's financing. Revenues are largely raised from the individual income tax and the payroll tax, with corporate and other taxes accounting for the remaining revenues. Spending largely breaks down into several main categories: health care programs, Social Security, defense spending, domestic spending, other non-health mandatory spending, and interest on the debt.
In 2013, the federal government is estimated to have spent roughly $3.5 trillion and raised $2.8 trillion in revenues.

What Is the Difference Between Deficits and Debt?
Deficits refer to the annual amount that the federal government must borrow each year to make up for any gap between spending and revenues. Conversely, when revenues are greater than spending, the government runs a surplus -- as was the case between 1998 and 2001. In FY 2013, the deficit was $680 billion or just over 4 percent of GDP. This borrowing accumulates over time and the total amount that is owed is the nation's debt. There are three commonly cited measurements of debt: gross debt, debt subject to the limit, and debt held by the public.
Public debt is the measure that is most meaningful to economists and experts. It refers to the debt owed to investors outside of the federal government -- including domestic and international investors, foreign governments, and the Federal Reserve. Gross debt includes all public debt, as well as securities the federal government owes to itself -- like the Social Security and highway trust funds.
Additional Resources:
- Historical deficit, public debt, and other budget data: Congressional Budget Office; Office of Management and Budget
- Current and historical debt levels, under various measures, by the day: Treasury Direct
What Do Current Debt Projections Look Like?
The nominal dollar figures of current and future debt levels are ultimately not as important as its relative magnitude of the debt compared to the size of the economy. That way, we can know how the size of the debt compares to national income, which represents the extent to which we can pay for it.
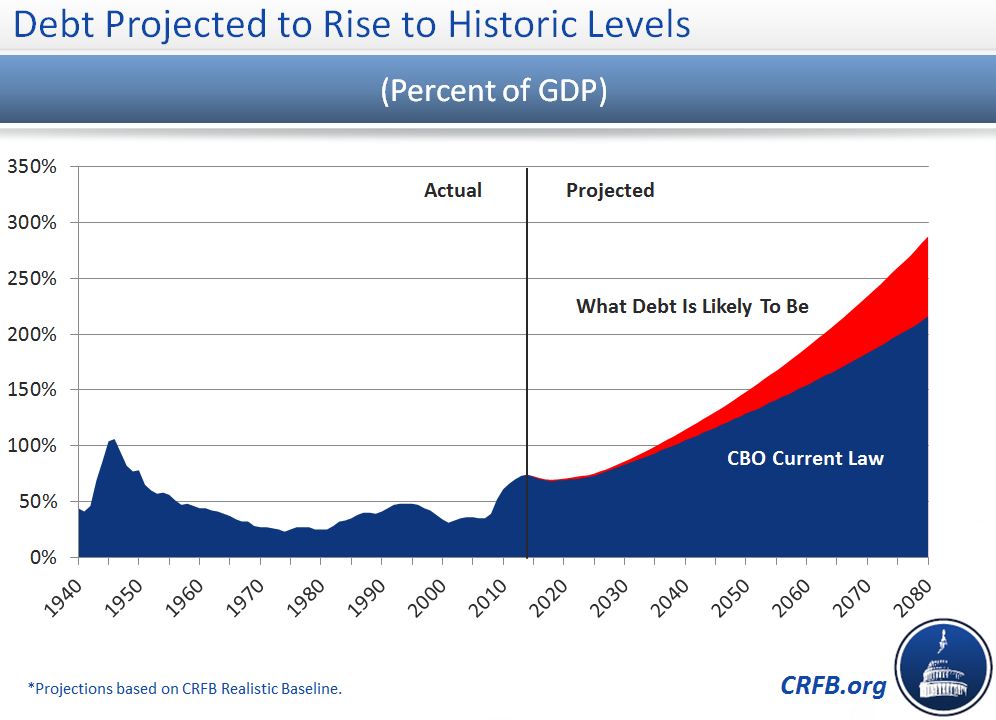
Currently, public debt stands at over $12 trillion, which is about 73 percent of GDP. It will fall to 69 percent by 2018 due to a recovering economy and already-enacted deficit reduction measures. However, after 2018, debt will rise indefinitely to reach 73 percent of GDP by 2023, 100 percent by 2034, nearly 150 percent of GDP by 2050, and twice the size of the economy by the 2060s. Debt is presently twice its historical average and the highest it has been since the immediate aftermath of World War II, but it's the trajectory - a clear upward path - that makes the outlook unsustainable and worrisome.

Learn more:
- CRFB. "Why Does the Debt Matter?"
- CRFB. "Our Debt Problems Are Far from Solved." May 15, 2013.
- CRFB. "Our Long-Term Debt Problems Are Very Far from Solved." November 20, 2013.
What Is the Story With Revenues?
Revenues in FY2013 are estimated to total nearly $2.8 trillion, or around 17 percent of GDP. As a result of a weak economy, revenue levels have been lower than usual but will rise this decade to 18.5 percent of GDP as the economy recovers and as new revenues are generated from the 2013 fiscal cliff deal and the President's health care law. From there, CRFB's long-term projections assume graudal increases in revenues as a result of rising incomes moving people into higher tax brackets. However, revenues will fall far short of total spending in every year, and by growing amounts.
Currently, the tax code contains hundreds of special loopholes, referred to as tax expenditures, that are often thought of as spending, only under a different name. These provisions may intend to advance important policy goals -- for example, homeownership via the mortgage interest deduction and charitable giving via the charitable deduction -- but they forgo substantial revenues and may create large economic distortions. The Joint Committee on Taxation, Congress's tax estimating arm, has projected that tax expenditures will account for $1.3 trillion in lost revenues in 2013. Many advocates, including CRFB, believe that lawmakers should seek to reform the tax code in a pro-growth way to raise new federal revenues -- an approach best served by taking a hard look at the hundreds of tax breaks currently in place.
Learn more:
What Does the Spending Side of the Budget Look Like?
Non-interest, or "primary", spending can largely be categorized as either discretionary spending or mandatory spending. Discretionary spending refers to the funds that Congress annually appropriates and reviews each year. It includes nearly all spending on defense as well as many non-defense programs like those for education, housing, transportation, international relations, justice, investment and research, food and drug oversight, national parks, and many others. Since a full appropriation bill was not passed for FY 2014, or even FY2013 for many discretionary programs, the government has been operating under a temporary continuing resolution that will expire on January 15, 2014.
Mandatory spending programs, on the other hand, are not subject to the appropriations process and are also commonly referred to as entitlement programs. Examples of these programs include Social Security, Medicare, Medicaid, the new Affordable Care Act health exchanges, Pell Grants, and agricultural subsidies. It is mandatory spending, particularly on health care programs, that is driving much of the explosion of deficits and debt in the long term. Spending on mandatory programs will grow from 12.2 percent of GDP in 2013 to 13.6 percent in 2023, 15.3 percent in 2030, and 18.2 percent in 2050, while discretionary spending will fall to historical lows as a share of GDP over the next few years.
Additional Resources:
- More information about Social Security, health care, and other spending programs
- More information about discretionary spending
- Reform options for spending programs: CBO, CRFB
How Is the Federal Budget Decided Each Year?
Each year, Congress only sets spending levels for discretionary spending programs, with mandatory spending and revenues set on autopilot. For an overview of the how the federal budget process works, or rather how it is supposed to work, see CRFB's overview page on the federal budget process.