CBO Shows $782 Billion Deficit for FY 2018
Late last week, the Congressional Budget Office (CBO) released its estimate of the final FY 2018 deficit. CBO estimates that the deficit increased to $782 billion this year, a $116 billion, or 17 percent, increase from FY 2017. The deficit is 3.9 percent of GDP, also up from 3.5 percent in 2017. Not surprisingly, recent legislation plays a big role in the deficit increase.
The $116 billion increase in the deficit comes from largely flat revenue coupled with increasing spending. Revenue was up only $13 billion, or 0.4 percent. This revenue growth rate is the eighth lowest in the past 50 years, and the seven lower years either coincided with a recession or tax cuts/expiring tax increases enacted shortly after a recession. As we have noted, though, even this slight revenue growth overstates how the 2017 tax law is affecting revenue since the fiscal year totals include revenue raised from the pre-tax law code. CBO's final numbers show that non-withheld income and payroll tax payments, which are almost entirely based on the 2017 tax code, were up $81 billion, which in addition to $27 billion of increases from October-December 2017 revenue, mean that revenue would have declined by about $95 billion, or 4.3 percent, when those totals are excluded.
| Budget Area | FY 2017 Total | FY 2018 Total | Percent Growth (Adjusted)* |
|---|---|---|---|
| Non-Withheld Income and Payroll Tax Payments | $386 billion | $467 billion | 21.0% |
| October-December 2017 Revenue | $710 billion | $737 billion | 3.8% |
| Other Revenue | $2.219 trillion | $2.124 trillion | -4.3% |
| Revenue | $3.315 trillion | $3.328 trillion | 0.4% |
| Social Security | $934 billion | $977 billion | 4.6% |
| Medicare | $595 billion | $585 billion | 2.7% |
| Medicaid | $375 billion | $389 billion | 3.9% |
| Defense | $569 billion | $599 billion | 6.4% |
| Other Non-Interest Spending | $1.199 trillion | $1.189 trillion | 0.4% |
| Interest on the Debt | $310 billion | $371 billion | 19.9% |
| Spending | $3.981 trillion | $4.110 trillion | 4.4% |
| Deficit | $666 billion | $782 billion | 24% |
Source: Congressional Budget Office
*Adjusted for timing shifts that artificially reduce Medicare and other spending
Outlays were up $129 billion over FY 2017, though that total would be $175 billion, or 4.4 percent, after accounting for payments shifted from FY 2018 to FY 2017. Social Security spending grew 4.6 percent, while Medicare grew at a relatively slow 2.7 percent, and Medicaid grew by 3.9 percent. Defense spending grew at 6.4 percent, a more rapid rate than recent years due to this year's budget agreement that increased the defense spending cap substantially. Perhaps most notably, interest spending was up 20 percent, with about 45 percent of that growth due to higher inflation and the rest reflecting higher interest rates and debt.
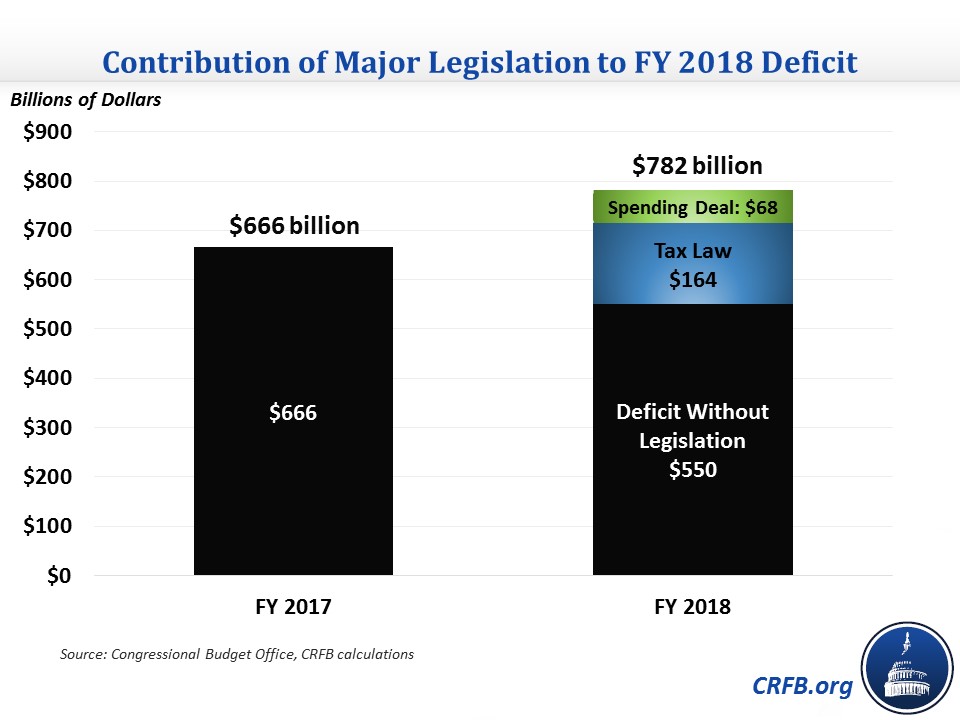
Recent legislation's role in the increased deficits is very clear. CBO estimated that the tax law would cost $164 billion in FY 2018, which would account for the entire deficit increase. The spending deal was estimated to cost $68 billion, which would account for about 60 percent of the increase. These estimates suggest that if neither of these laws were enacted, the deficit would have declined to about $550 billion this year. Both laws are expected to cost more next fiscal year ($228 billion and $185 billion, respectively), as the deficit is expected to reach nearly $1 trillion.

The Treasury Department will have official numbers later this month, but they are likely to be close to what CBO has estimated, and the news is not good. The deficit increased significantly in FY 2018, and it is expected to continue to increase in the future.


