CBO Releases Analysis of the Distributional Impact of Tax Expenditures
The CBO released a paper today analyzing the distributional impact of major tax expenditures on the individual side of the tax code. Considering the tax reform efforts underway, the report is particularly timely as lawmakers take a look at the myraid of preferences in the law. The new analysis estimates that the 10 largest tax expenditures will cost the federal government $900 billion in revenue in fiscal year 2013 alone and $12 trillion from 2014-2023. That amounts to an estimated 5.7 percent and 5.4 percent of GDP, respectively.
Specifically, the CBO's paper considered exclusions from taxable income like employer-sponsored health insurance, retirement account and pension contributions, step-up basis for capital gains at death, and exclusion of Social Security benefits; itemized deductions like the mortgage interest deduction, state and local tax deduction, and charitable contribution deduction; preferential tax rates on capital gains and dividends; and tax credits like the earned income tax credit and the child tax credit.
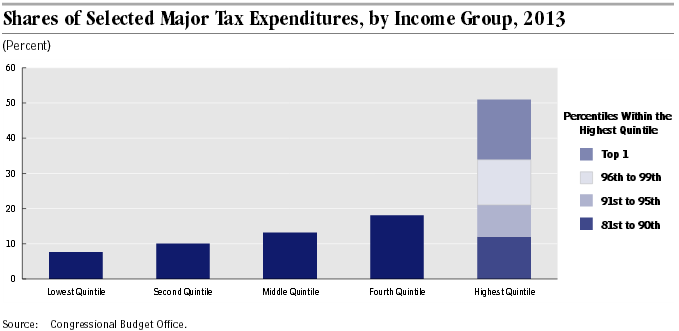
The tax expenditures CBO analyzed are quite large, all of them reducing revenue by more than $30 billion each in 2013 alone and by as much as $250 billion in the case of the exclusion for employer-paid health insurance premiums. Furthermore, many of the larger tax expenditures, particularly the deductions and provisions related to capital gains and retirement savings, confer disproportionate benefits on higher earners, as seen in the chart below.
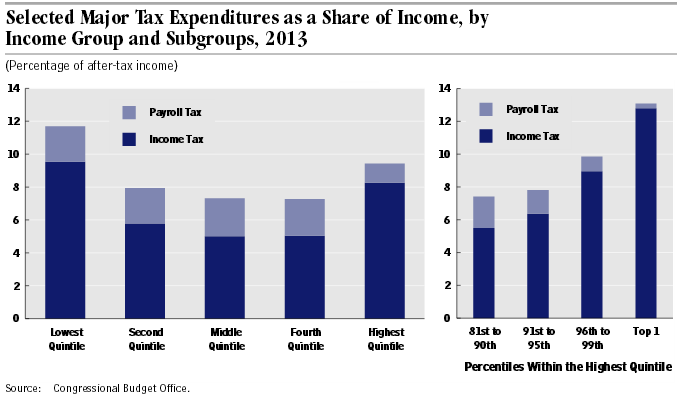
The distributional picture changes when measured as a percentage of after-tax income, with the largest benefit by quintile going to the lowest one. These households mainly benefit from the earned income tax credit and child tax credit, so the picture changes significantly when looking at the other provisions. Tax expenditures benefit the top quintile to the tune of 9 percent of after-tax income, and they equal 13 percent for the top 1 percent, the largest benefit to any of the income groups CBO provided. It should be noted that since CBO's analysis only shows the benefit in 2013, it excludes tax credits for purchasing health insurance in the exchanges created in the Affordable Care Act that will be in effect starting in 2014. These expenditures will mainly benefit the lower and middle quintiles and could amount to 0.4 percent of GDP from 2014-2023.
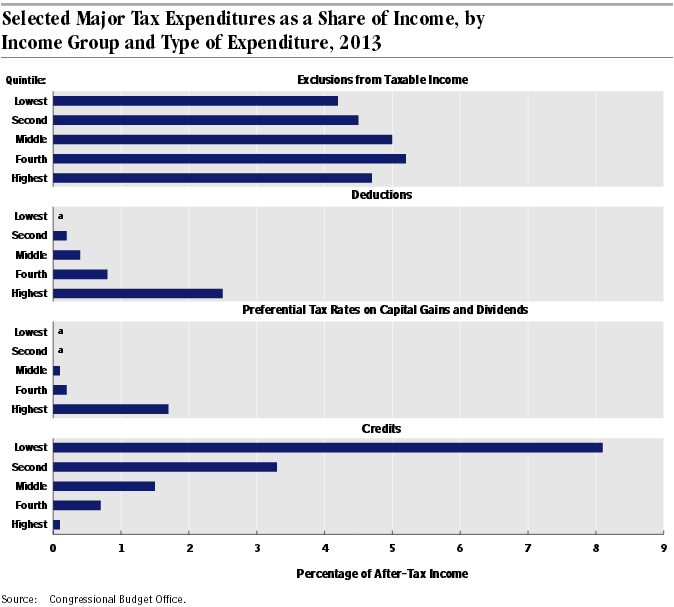
Different types of tax provisions have different distributional impacts. As shown by the graph below, lower-income earners benefit most from the credits because credits phase out at higher incomes, they are less likely to be able to benefit from the other preferences, and the benefit of a deduction or exclusion rises with one's marginal tax rate. This is one reason why bipartisan plans like Simpson-Bowles and Domenici-Rivlin proposed converting a few of the deductions they did choose to keep into credits: to make those tax breaks more progressive while raising revenue.
This new analysis is further proof that many tax provisions overwhelmingly benefit more well-off taxpayers. As we have said before, tax expenditures have an outsized impact on the budget, necessitate higher individual rates, and further complicate our already inefficient tax code. Certain tax expenditures may be worthwhile, but Congress certainly has a lot of room to raise revenue from them and simplify the code.

