The Story of Supplementals Since 2000
The use of supplemental appropriations got some press last month as the Obama Administration requested $4.3 billion to address the Central American migrant crisis and fight wildfires. Although neither funding measure passed, it showed the role that supplementals continue to play in the appropriations process. Lawmakers use supplemental appropriations to respond to needs that they did not foresee when they passed government funding measures. To see how much activity has taken place outside of the "regular" process, CBO has helpfully recapped in a new report total supplemental appropriations since 2000 (see the data in Excel here). They break down spending by year and type, showing both the amounts that have been requested and what ultimately was passed into law.
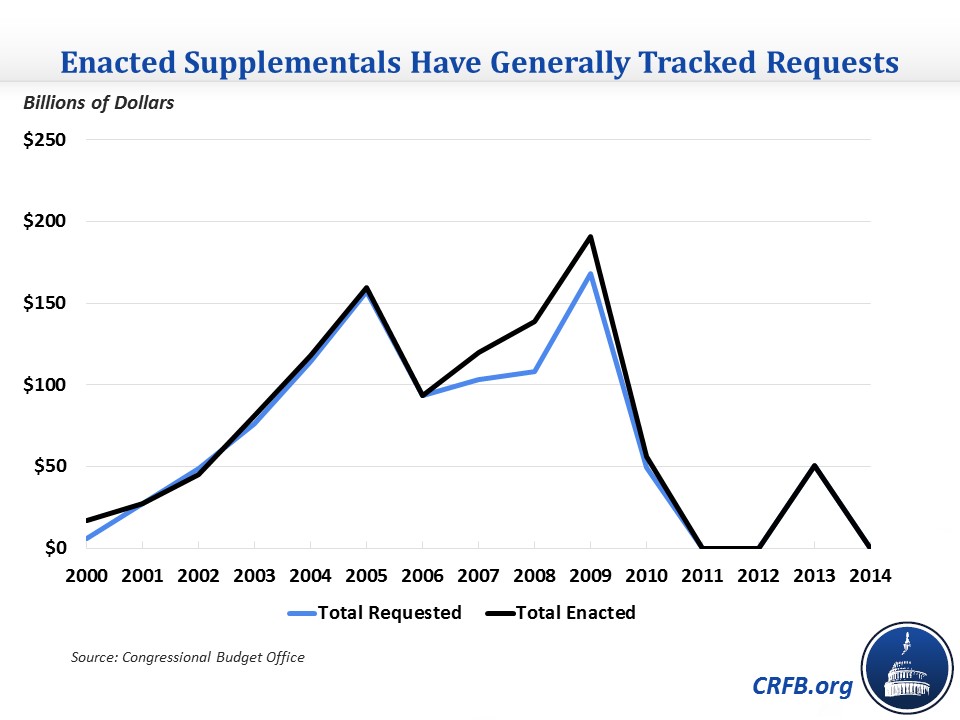
Overall, Presidential administrations have requested $1 trillion over the past 15 fiscal years, and Congress has enacted $1.1 trillion of appropriations ($1.15 trillion of gross spending net of $50 billion in rescissions of past authorized spending). The enacted amount is equal to 0.5 percent of GDP over that period, and it peaked at 1.3 percent ($191 billion) in 2009 when war spending was near its peak; by contrast, there was no supplemental spending in 2011 and 2012 and only $225 million so far in 2014. Including interest brings total spending to $1.4 trillion, or 0.7 percent of GDP.
The total amount from 2000-2014 exceeds the amount requested by 10 percent, or 0.7 percent per year on average, much of it coming from non-defense spending in the 2007-2009 period. The significant size of supplemental spending since 2000 shows one reason why stabilizing the debt isn't an ambitious enough target: lawmakers often have to respond to emergencies or fund other priorities above what budget projections envision.
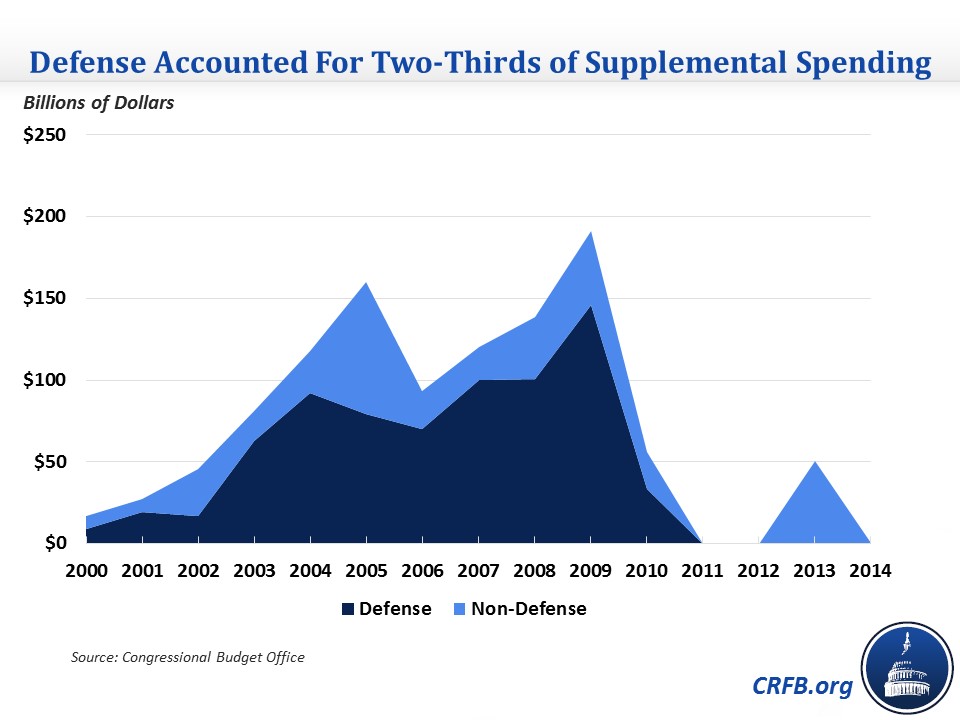
Defense spending represented two-thirds of the spending enacted while non-defense spending was one-third. This ratio is not surprising since the war spending was financed through supplementals from 2003 to 2009; more than four-fifths ($900 billion) of total supplemental spending happened in those years. For years other than those seven, non-defense spending took up 70 percent, while defense got 30 percent.
While appropriations generally deal with discretionary spending, there have also been mandatory spending increases enacted through supplementals, though it is just 1 percent of spending since 2000. Most of that came in a 2010 supplemental, but notably the original expansion of unemployment benefits was done through a 2008 supplemental.
Supplementals have often been used for legitimate emergency spending, such as the responses to 9/11 and hurricanes, but supplementals have also been used to evade budget rules. Perhaps the most egregious example is the use of the emergency designation in a 2008 supplemental for carrying out the census, a function that the federal government has carried out since the country's inception.
CBO's data tell a tale of a supplemental appropriations process that continues to play a significant role in the overall budget process. Supplemental spending since 2000 has made debt 8 percentage points of GDP higher in 2014 than it would have been otherwise. While much of this was from war spending that eventually got folded back into the normal process, there has still been significant spending in recent years (Hurricane Sandy relief, for example). Having the fiscal space to deal with unforeseen situations is important, so putting debt on a downward path should be seen as a crucial goal to ensure that the federal government will still be able to respond to emergencies in the future.
Click here to see the CBO data in Excel.