The Post-SGR Budget Outlook
Lawmakers cleared their second Fiscal Speed Bump of the year - the expiration of the one-year "doc fix" - earlier this month, scuttling the Medicare Sustainable Growth Rate (SGR) formula for good by adding $141 billion to deficits through 2025 ($175 billion with interest). As a result, CBO's last baseline in March is now slightly out of date, and the agency usually doesn't release new ten-year numbers until August, so here's our estimate of what the baseline looks like in the post-SGR world.
The new law increases debt by about one percentage point of Gross Domestic Product (GDP) by 2025, from 77 percent to 78 percent. It also increases ten-year deficits and health care spending by about one-tenth of a percent of GDP while slightly increasing interest spending from 2.9 to 3 percent of GDP in 2025. Not surprisingly, the law slightly increases the share of spending going to health care and interest.
| The New Ten-Year Budget Outlook (Percent of GDP) | ||||||||||||
| 2015 | 2016 | 2017 | 2018 | 2019 | 2020 | 2021 | 2022 | 2023 | 2024 | 2025 | 2016-2025 | |
| Revenue | 17.7% | 18.4% | 18.3% | 18.1% | 18.1% | 18.1% | 18.1% | 18.1% | 18.2% | 18.2% | 18.3% | 18.2% |
| Health Care* | 5.2% | 5.4% | 5.3% | 5.2% | 5.5% | 5.5% | 5.6% | 5.9% | 5.9% | 5.8% | 6.1% | 5.7% |
| Medicare | 3.0% | 3.0% | 2.9% | 2.8% | 3.0% | 3.1% | 3.2% | 3.5% | 3.4% | 3.3% | 3.6% | 3.2% |
| Medicaid/CHIP | 2.0% | 2.0% | 2.0% | 2.0% | 2.0% | 2.0% | 2.0% | 2.1% | 2.1% | 2.1% | 2.1% | 2.1% |
| Exchange | 0.2% | 0.3% | 0.4% | 0.4% | 0.4% | 0.4% | 0.4% | 0.4% | 0.4% | 0.4% | 0.4% | 0.4% |
| Social Security | 4.9% | 4.9% | 4.9% | 5.0% | 5.1% | 5.2% | 5.3% | 5.4% | 5.5% | 5.6% | 5.7% | 5.3% |
| Other Mandatory | 2.6% | 2.9% | 2.8% | 2.6% | 2.5% | 2.5% | 2.4% | 2.5% | 2.3% | 2.2% | 2.3% | 2.5% |
| Discretionary | 6.5% | 6.3% | 6.0% | 5.8% | 5.7% | 5.6% | 5.5% | 5.4% | 5.3% | 5.2% | 5.1% | 5.5% |
| Interest | 1.3% | 1.5% | 1.7% | 2.0% | 2.2% | 2.4% | 2.6% | 2.7% | 2.8% | 2.9% | 3.0% | 2.4% |
| Total Spending | 20.5% | 20.9% | 20.7% | 20.6% | 21.0% | 21.2% | 21.4% | 21.9% | 21.8% | 21.7% | 22.2% | 21.4% |
| Deficit | -2.7% | -2.5% | -2.4% | -2.5% | -2.9% | -3.2% | -3.3% | -3.8% | -3.7% | -3.5% | -3.8% | -3.2% |
| Debt | 74.2% | 73.9% | 73.5% | 73.2% | 73.5% | 73.9% | 74.5% | 75.4% | 76.2% | 76.8% | 77.8% | N/A |
Source: CRFB calculations based on CBO data
*Includes net Medicare, Medicaid/CHIP, and health insurance exchange subsidies
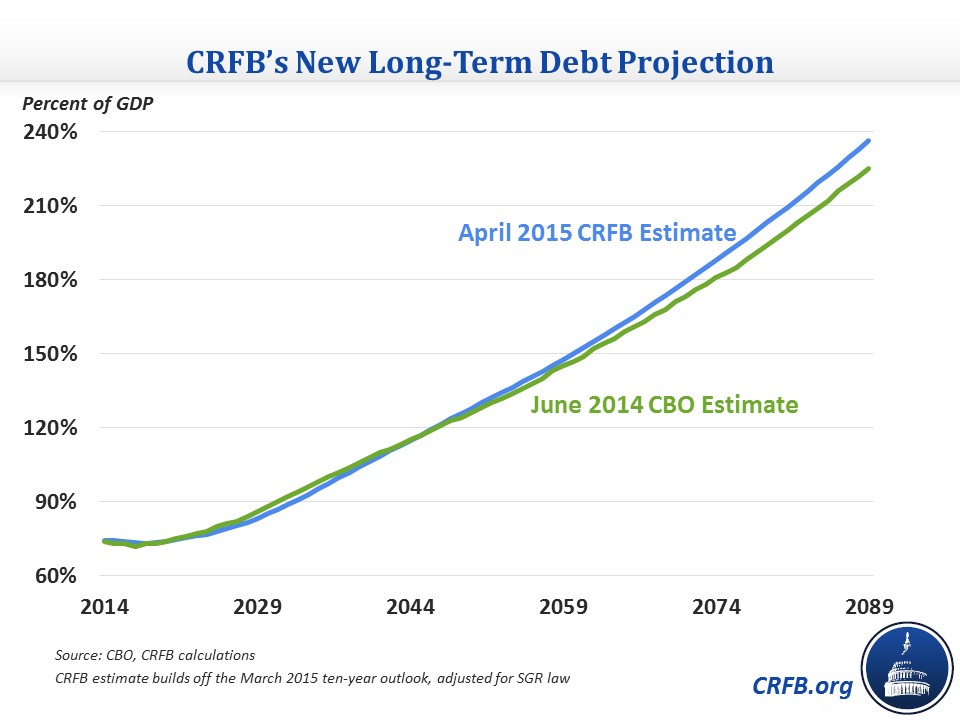
We also can produce long-term budget projections building off this ten-year outlook with extrapolations based on the Congressional Budget Office's (CBO) long-term outlook. Just as their outlook showed last June, we find a clear upward path for debt over the long term, with it exceeding the size of the economy by the late-2030s and reaching over 200 percent by around 2080.
Overall, spending rises significantly and becomes more heavily concentrated in Social Security and especially health care and interest spending, while revenue rises much more slowly.
| The New Long-Term Budget Outlook (Percent of GDP) | ||||||||
| 2015 | 2025 | 2035 | 2045 | 2055 | 2065 | 2075 | 2085 | |
| Revenue | 17.7% | 18.3% | 19.0% | 19.9% | 20.8% | 21.7% | 22.6% | 23.5% |
| Health Care* | 5.2% | 6.1% | 7.5% | 8.7% | 9.8% | 11.0% | 12.2% | 13.4% |
| Social Security | 4.9% | 5.7% | 6.4% | 6.2% | 6.3% | 6.5% | 6.7% | 6.8% |
| Other Mandatory | 2.6% | 2.3% | 1.9% | 1.6% | 1.4% | 1.1% | 1.0% | 0.8% |
| Discretionary | 6.5% | 5.1% | 5.1% | 5.1% | 5.1% | 5.1% | 5.1% | 5.1% |
| Interest | 1.3% | 3.0% | 4.2% | 5.2% | 6.1% | 7.2% | 8.5% | 9.9% |
| Total Spending | 20.5% | 22.2% | 25.1% | 26.8% | 28.7% | 31.0% | 33.5% | 36.0% |
| Deficit | -2.7% | -3.8% | -6.1% | -6.9% | -7.9% | -9.3% | -10.9% | -12.5% |
| Debt | 74% | 78% | 95% | 117% | 139% | 163% | 191% | 223% |
Source: CRFB calculations based on CBO data
*Includes net Medicare, Medicaid/CHIP, and health insurance exchange subsidies
The budget outlook was already clearly unsustainable, and the SGR replacement law has made the situation worse by increasing spending in the fastest growing non-interest area of the budget. We will see in the coming months how much CBO has changed its budget outlook; for now, we estimate that it is certainly not getting any better.
What's Next
-
Image
-
Image
-
