More Interesting Charts from CBO Director Elmendorf's Presentation
Earlier in the week, we highlighted a portion of CBO Director Doug Elmendorf's presentation at Cornell University highlighting the increased resources going to health care, Social Security, and interest spending to the detriment of the rest of the budget. In addition, the slideshow contained other helpful charts showing how the federal budget could change over the next decade, the choices policymakers face to alter the trajectory of debt, and a further look at the impacts of the Affordable Care Act. Here are some of the more interesting charts from that presentation.
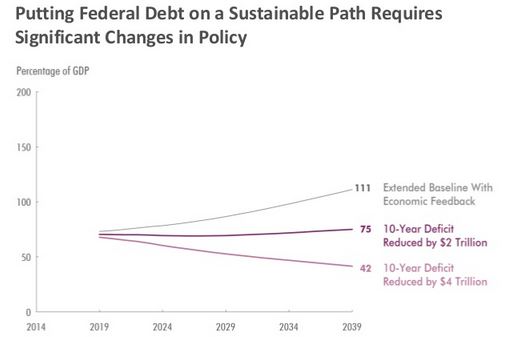
Putting Debt on a Sustainable Path Requires Significant Changes
With debt set to continue to rise as a percent of GDP, simply maintaining the status quo will require significant changes. Keeping debt stable at its current elevated level of 74 percent of GDP for the next 25 years would require $2 trillion of savings over ten years, twice as much as the savings in the President's budget. Getting debt close to its historical average of 40 percent of GDP in 25 years will require $4 trillion in ten-year savings.
Individual Income Tax Revenue is the Only Growing Revenue Stream
CBO's ten-year projections show only a modest rise in revenue as a share of GDP over the next decade, from 17.5 percent to 18.2 percent, and in fact from 2015 to 2024 revenue will remain roughly flat.
The graph below shows why. While individual income tax revenue will rise gradually over time, other sources are expected to stay flat or decline. Payroll tax revenue will fall slightly, corporate revenue will rise next year but fall back to its 2014 level by 2024, and other revenue will fall over the next few years as the Federal Reserve unwinds its balance sheet and thus lowers its earnings.

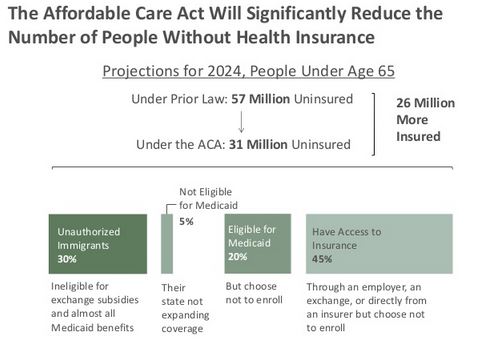
Who Will Still Be Uninsured?
One of the more interesting charts shows the reasons why people will remain uninsured after the Affordable Care Act has fully taken effect. While CBO expects the ACA to increase insurance coverage by 26 million people on net in 2024, it will still leave 31 million people uninsured. However, two-thirds of these people are eligible for coverage through either through their employer, the health insurance exchanges, or Medicaid but are expected to choose not to enroll. Five percent will be in states that have chosen not to expand Medicaid, and the remaining portion is unauthorized immigrants who are not eligible for insurance coverage.
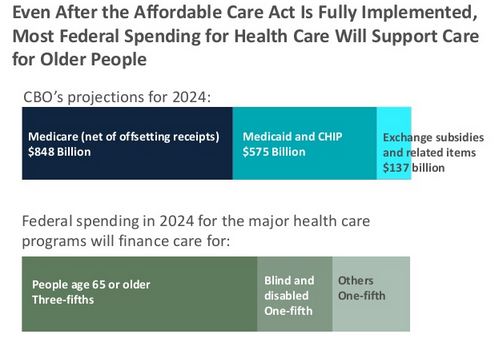
Health Care Spending Will Still Mostly Go to the Elderly and Disabled
The Affordable Care Act's Medicare spending reductions and coverage expansions for people below age 65 produce some shift in health care spending away from the elderly and toward the young, but the distribution will still remain heavily skewed toward the elderly and disabled -- with three-fifths and one-fifth of health care spending, respectively, going toward those two groups. Obviously, one would expect they would take up a disproportionate share of spending since those populations are more expensive to care for than the rest of the population (as an example, 2024 per-person Medicaid spending will be six times higher for the elderly than for children). Further, the majority of the below-65 population still gets insurance through their employer; that coverage is not subsidized by direct spending but rather by the health tax exclusion and thus is not counted as spending.
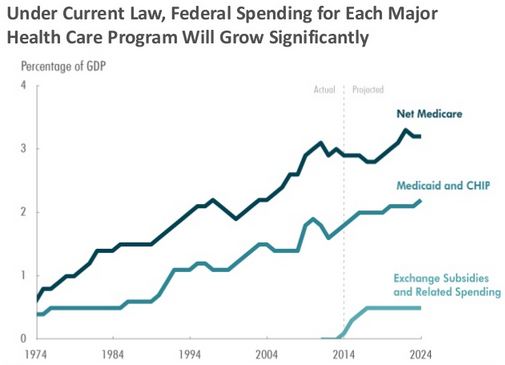
Health Care Spending Will Increase Over the Next Decade
It is no secret that health care is one of the fastest increasing areas of the budget. As a percent of GDP, spending on the major health care programs will increase from 4.9 percent this year to 5.9 percent in 2024. But growth within each program is uneven over the next decade. Medicaid and the exchange subsidies will grow rapidly in the short term as the ACA coverage expansions ramp up but grow more slowly later on once those effects have fully phased in. Conversely, Medicare growth will be subdued in the short term due to slow health care cost growth and ACA payment cuts but is projected to pick up later as cost growth accelerates and more and more baby boomers enter and age through the program.
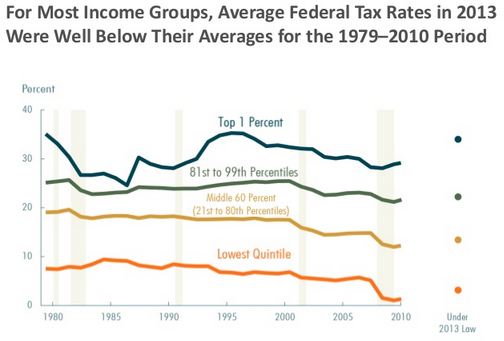
Average Tax Rates Are Below Where They Were for Much of the Last Three Decades
The fiscal cliff deal extended the 2001/2003/2010 tax cuts for everyone but the top 1 percent, and the graph below largely reflects the result. Tax rates in 2013 for the lowest fifth, middle 60 percent, and top fifth excluding the top one percent will be below where they were for much of the last three decades. The lowest quintile and middle 60 percent will see slightly higher tax rates than in 2010 due to the expiration of temporary tax cuts like the Making Work Pay tax credit and payroll tax holiday, but will still have relatively low tax rates. Meanwhile, the top 1 percent will see tax rates rise to their highest levels since 1979 other than the early 1980s and mid-1990s.
Both Defense and Non-Defense Discretionary Spending Will Fall to Modern-Day Historic Lows
This was a key point in Elmendorf's presentation, but it is worth noting that the historic decline in discretionary spending applies to both defense and non-defense areas. By 2023, discretionary spending will be at its lowest point since before 1962, with defense at 2.8 percent of GDP and non-defense at 2.5 percent. Note that defense spending would be even lower if we assume that war spending is drawn down over time instead of increased with inflation.

Tags
What's Next
-
Image
-
Image
-
