GAO's Long-Term Budget Outlook
Last week, the Government Accountability Office (GAO) released its long-term fiscal outlook, presenting both long-term projections and estimates of the fiscal gap. Since the last longer-term projections from CBO came out in June, the report provides a good measure of what the budget looks like after the American Taxpayer Relief Act and the challenge we face going forward.
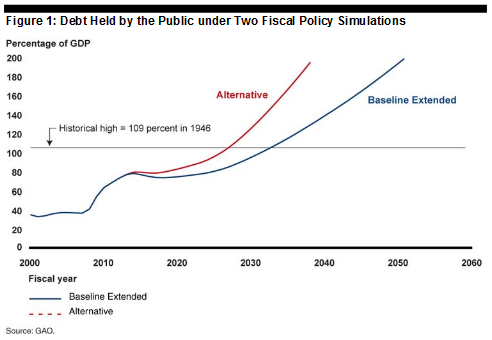
GAO presents two simulations: a baseline extended scenario similar to CBO's current law and an alternative simulation similar to CBO's AFS with a few differences, particularly on health. The baseline extended projection incorporates all of assumptions of CBO's current law on revenue and spending, except that it uses the Medicare Trustee's projections that assumes the Affordable Care Act will reduce health care excess cost growth (growth in excess of GDP growth) to an annual rate of 0.2 percent. The alternative simulation assumes that expiring tax provisions are extended and revenues return to their historical average of 17.9 after 2023, the sequestration is waived, discretionary spending gradually returns to its historical average of 7.5 percent, and health care spending follows CMS's alternative scenario that prevents the reductions in payments to doctors due to the SGR and assumes cost-restraint provisions in the ACA have limited effect.
Debt would rise to over 120 percent of GDP by 2030 under GAO's alternative projection and rise to 90 percent of GDP under the extended baseline. While debt shortly stabilizes at the end of this decade, the rapid aging of the population in the 2020's will put debt on a steep upward path.
Long-term debt projections convey the severity of the problem but do not neccesarily give an indication of the size of the necessary solution. In this light, GAO also estimates the federal government's "fiscal gap" or the present value difference between primary revenues and spending over a certain time period. GAO estimates a fiscal gap of 3.9 percent of GDP under its baseline scenario and 8.0 percent under its alternative projection. The table below shows by what percentage revenues would have to increase or spending would have to decrease in order to close the fiscal gap. As can be clear seen in the table, the needed changes become much larger the longer policymakers wait.
| Federal Fiscal Gap Under Our Simulations | |||||
| Average Percentage Change Required to Close Gap | |||||
| If Action is Taken Today | If Action is Delayed Until 2023 | ||||
| Scenario | Fiscal gap 2013–2087 | Solely Through Revenues | Solely Through Spending | Solely Through Revenues | Solely Through Spending |
| Baseline Extended | 3.9% of GDP | 20.4% | 17.4% | 24.3% | 20.4% |
| Alternative | 8.0% of GDP | 44.4% | 31.5% | 53.2% | 36.3% |
Source: GAO
Often, the discussion is wrapped in ten-year projections because that is the window CBO uses for its budget outlook and its scores of legislation. But the debt is a much greater issue in the long term, and policies that address entitlement and tax reform that could have a greater effect beyond this next decade should be the focus.
Click here to read the full report.